
Extended Data Figure 3. Detergent treatment causes contraction of the cell wall across a range of conditions and organisms.
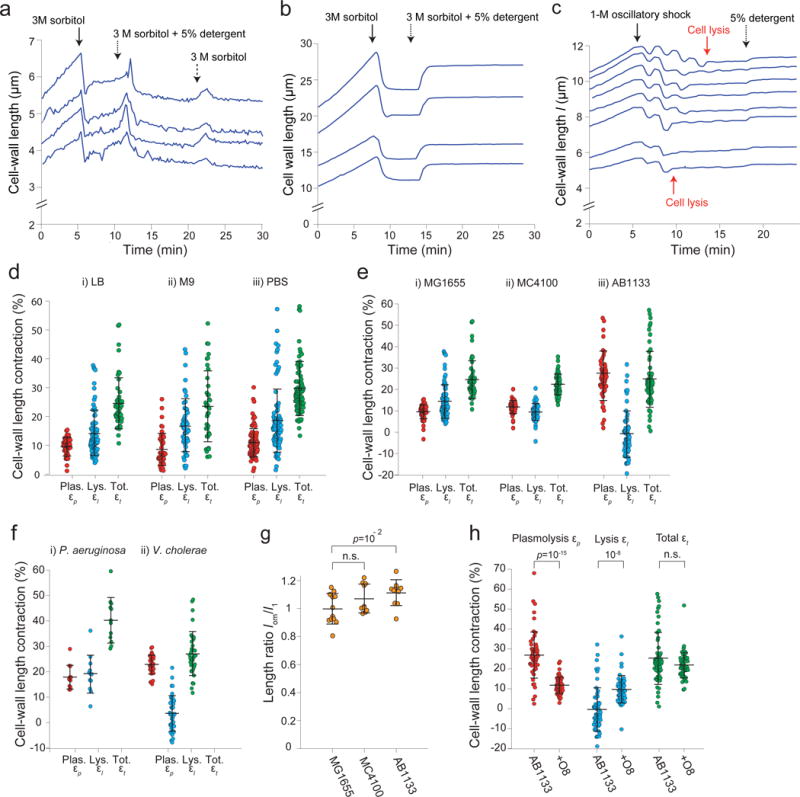
a) Length of the cell wall versus time during hyperosmotic shock (3 M sorbitol, solid arrow) and subsequent treatment with detergent (5% N-lauroyl sarcosine, dotted arrow), and washout of the detergent (switching back to 3 M sorbitol, dashed arrow) for four representative cells (n = 260 cells). The cells briefly swelled upon washout, then relaxed to the pre-washout rest length. We speculate that the brief swelling is caused by a hypoosmotic shock during washout (lowering the concentration of detergent). That is, we propose that the detergent has a slow diffusion constant through the cell wall, and therefore washing it out imposes a transient hypoosmotic shock, before detergent within the cell diffuses out of it. When it does, the cell wall relaxes again to its rest state, demonstrating that cell-wall contraction upon detergent treatment is not due to compaction by the detergent.
b) Lengths of the cell wall versus time during hyperosmotic shock (3 M sorbitol, solid arrow) and subsequent addition of detergent (5% N-lauroyl sarcosine, dotted arrow) for four representative B. subtilis cell chains (n = 112 cell chains). Rather than contract upon detergent treatment, the cell walls re-extend. We hypothesize that the cell wall is in a highly compressed state after 3-M hyperosmotic shock because the cytoplasm is exerting an inward force via connections between the plasma membrane and cell wall. When the plasma membrane is dissolved with detergent, this force is relieved and the cell wall extends to its rest length.
c) Lengths of the cell wall of B. subtilis cell chains versus time during a 1-M oscillatory osmotic shock, which caused cell lysis (e.g., red arrows), followed by treatment with detergent (5% N-lauroyl sarcosine, dotted arrow; n = 93 cell chains). The cell walls expanded only slightly upon detergent addition, indicating that it is lysis rather than detergent treatment that causes the re-extension in (b).
d) Contraction upon plasmolysis, subsequent lysis, and total contraction for three environmental conditions: i) LB (n = 79, 56, 56 cells, respectively), ii) M9 (n = 46, 52, 38 cells, respectively), and iii) cultured in LB and transferred to PBS before plasmolysis (n = 95, 86, 94 cells, respectively). Error bars indicate ±1 s.d.
e) Contraction upon plasmolysis, subsequent lysis, and total contraction for three wild-type E. coli strains: i) MG1655 (n = 79, 56, 56 cells, respectively), ii) MC4100 (n = 48, 48, 48, respectively), and iii) AB1133 (n = 56, 56, 56 cells, respectively). Error bars indicate ±1 s.d.
f) Contraction upon plasmolysis, subsequent lysis, and total contraction for i) Pseudomonas aeruginosa (n = 12, 12, 12 cells, respectively), and ii) Vibrio cholerae (n = 36, 36, 36 cells, respectively). Error bars indicate ±1 s.d.
g) The mean ratio between the rest length of the outer membrane, lom, and the length of the cell envelope in the fully turgid state, l1, for three wild-type E. coli strains (n = 12, 10, 10 cells for MG155, MC4100, and AB1133, respectively). The rest length of the outer membrane is approximately equal to length of the fully turgid cell for all three strains. Error bars indicate ±1 s.d. The p-value was calculated using a Student’s two-sided t-test.
h) Mean contraction upon plasmolysis, subsequent lysis, and total contraction for wild-type AB1133 (n = 56 cells) and an isogenic strain expressing the O8-antigen (n = 55 cels). The ratio for cells expressing the O8 antigen is very large because the contraction upon lysis for the parental wild-type strain (AB1133) was close to zero, and adding the antigen markedly increased contraction. Error bars indicate ±1 s.d. p-values were calculated using a Student’s two-sided t-test.