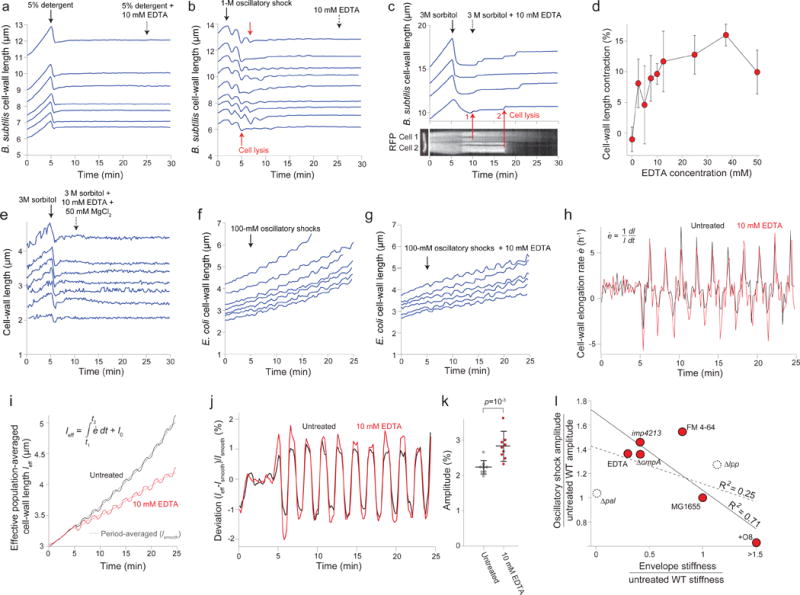
Extended Data Figure 5. EDTA weakens the E. coli cell envelope.

a) Length of the cell wall versus time for seven representative Bacillus subtilis cell chains during treatment with detergent followed by treatment with detergent + 10 mM EDTA (n = 68 cell chains). While detergent caused lysis, subsequent addition of EDTA did not affect cell-wall rest length.
b) Lengths of the cell wall of B. subtilis cell chains versus time during 1-M oscillatory osmotic shocks, which caused cell lysis (e.g., red arrows), followed by treatment with 10 mM EDTA (dashed arrow; n = 127 cell chains). EDTA did not affect the rest length of the cell walls.
c) (top) Length of the B. subtilis cell wall versus time through a hyperosmotic shock (3 M sorbitol, solid arrow) and subsequent treatment with 10 mM EDTA (dotted arrow) for 4 representative cell chains (n = 61 cell chains). Cell-wall length did not decrease after detergent, as for E. coli. (bottom) micrograph of a two-cell chain expressing cytosolic (strain HA405, left) and a kymograph showing fluorescence intensity along the dotted red line during the experiment in the top graph. The cell chain in the kymograph corresponds to the bottom-most length trace in the top graph. Red arrows demonstrate that the discrete increases in length observed after EDTA treatment correspond to cell lysis events, when fluorescence within the cells begin to decrease.
d) Population-averaged E. coli cell-wall length contraction upon EDTA application after plasmolysis increased with increasing concentration of EDTA (n = 131, 193, 225, 138, 81, 94, 36, 28, 72 cells, respectively). Error bars indicate ±1 s.d.
e) Length of the cell wall versus time during hyperosmotic shock (3 M sorbitol, solid arrow) and subsequent treatment with 10 mM EDTA + 50 mM MgCl2 (dotted arrow) for representative E. coli cells (n = 91 cells).
f) Length of the cell walls of representative E. coli cells during 100-mM oscillatory shocks with 2-min period (n = 243 cells).
g) Length of the cell walls of representative E. coli cells during a 100-mM oscillatory shock with 2-min period and 10 mM EDTA (n = 284 cells).
h) Population-averaged elongation rate of the E. coli cell wall during 100-mM oscillatory shocks with 2-min period for untreated (black line) and 10 mM EDTA-treated cells (n = 284 cells).
i) Effective population-averaged cell length (leff), calculated by integrating the population averaged elongation rate in (h) during 100-mM oscillatory shocks with 2-min period for untreated (black line) and 10 mM EDTA-treated cells (n = 284 cells). Dotted lines are the respective time-averaged leff using a rolling-window averaging filter with a 2-min window (equal to the period of oscillations).
j) Deviation of the effective population-averaged length in (i) from the respective time-averaged trace.
k) The mean amplitude of oscillation was found by averaging the peak-to-peak amplitude in (j) over cycles (n = 10 cycles). Error bars indicate ±1 s.d. The p-value was calculated using a Student’s two-sided t-test.
l) Amplitude of cell-wall length oscillations (ratio with respect to untreated wild-type; Fig. 2j) versus cell-wall stiffness calculated from plasmolysis-lysis experiments (ratio with respect to untreated wild-type; Fig. 2g). Solid line, linear best fit for only perturbations to the outer membrane (red circles; linear regression: R2 = 0.71, F = 9.7, p = 0.0356). Dashed line, best fit when additionally considering perturbations to protein linkages between the outer membrane and cell wall (dashed circles; linear regression: R2 = 0.25, F = 1.4, not significantly different from horizontal). For the O8-expressing strain, we conservatively used a stiffness ratio of 1.5 for the fits.
