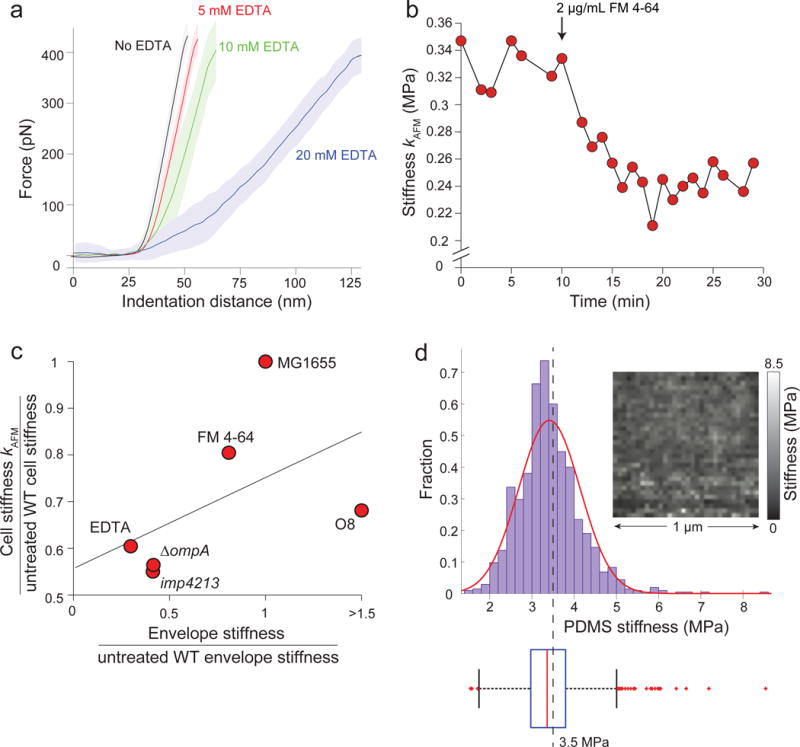
Extended Data Figure 6. FM 4-64 softens E. coli cells.

a) Cantilever force versus indentation distance during successively increasing EDTA concentrations, as in Fig. 3a. Lines indicate the average force-distance curves taken during the period in which the cell was treated with the given concentration of EDTA. Shaded areas indicate ±1 s.d (n = 4 cells). Stiffness was measured every minute during the 5-10 min periods when the cell was treated with each EDTA concentration. Average force curves were registered with respect to the onset of force increase as the cantilever was lowered.
b) Stiffness of a representative cell versus time, as measured with AFM. At t = 10 min the cell was treated with 2 μg/mL FM 4-64 (n = 3 cells).
c) The ratio of the cell stiffness computed with AFM (Fig. 3c) versus the ratio of envelope stiffness computed from plasmolysis-lysis experiments (Fig. 2g) across chemical and genetic perturbations. The solid line is the linear best fit (linear regression: R2 = 0.27, F = 1.4, not significantly different from horizontal). The numbers of cells used for each measurement are the same as given for Fig. 3c (AFM measurements of cell stiffness) and Fig. 2d-f (envelope stiffness). For the O8-expressing strain, we conservatively used a stiffness ratio of 1.5 for the fit.
d) Calibration of AFM measurements using a polydimethylsiloxane sample with known Young’s modulus of 3.5 MPa. (top) Distribution of measurements of Young’s modulus across the calibration sample. Red curve is Gaussian fit to the data. Dashed line is the mean. (top, inset) Young’s modulus measurements were spatially uniform. (bottom) Box plot of the distribution of Young’s modulus measurements showing the median stiffness (red line), 25% and 75% percentiles (edges of box), extreme bounds (whiskers), and outliers (red points).
