
Figure 2. Cellular mechanical properties depend on the composition and integrity of the outer membrane.
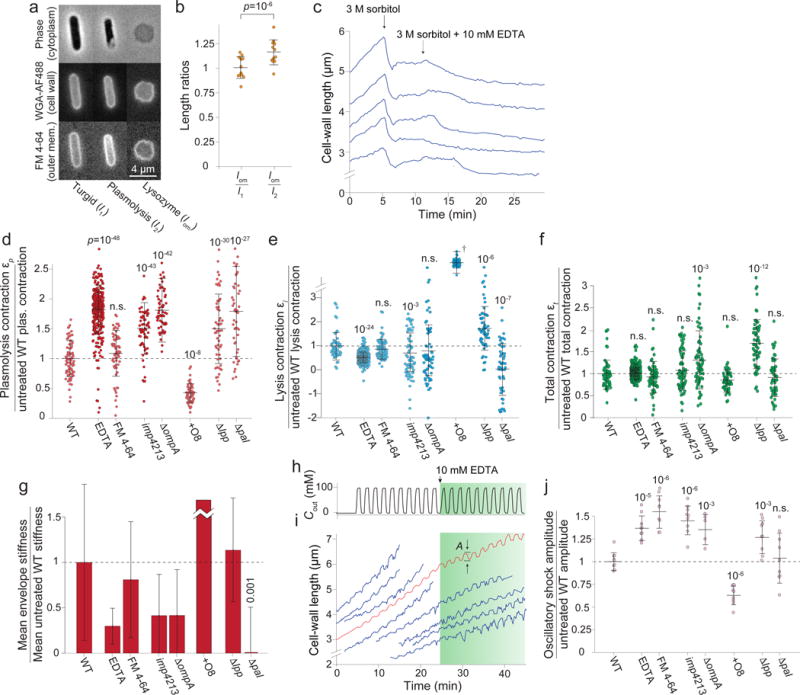
a) E. coli cells (turgid/plasmolyzed/lysozyme) stained as in Fig. 1b (1 experiment, similar results for two other wild-type strains, Extended Data Fig. 3g).
b) Left: mean ratio between the rest length of the outer membrane, lom, and the length of the turgid cell, l1. Right: mean ratio between lom and the length of the cell envelope during plasmolysis, l2 (n = 12 cells). Error bars: ± 1 s.d. p-value, paired two-sided t-test.
c) Length of representative cell walls versus time during hyperosmotic shock and treatment with EDTA (n = 184 cells total).
d-f) Cell wall length contractions upon (d) plasmolysis (e) lysis and (f) in total under chemical and genetic perturbations to outer membrane (ratio with respect to WT, n=79,309,65,70,65,55,59,50 cells). p-values: Student’s two-sided t-test, difference from untreated wild-type control. n.s.: not significant.
g) Outer membrane stiffness under chemical or genetic perturbations (ratio with respect to wild-type). Error bars, ± 1 s.d. Uncertainty propagated from εl and εp measurements.
h) Sorbitol concentration in growth medium during 100-mM oscillatory osmotic shocks with 2-min period.
i) Representative cell-wall lengths during shocks in (h) (blue traces; n = 243 cells). Green shaded period, EDTA included. Red curve, effective population-averaged length.
j) Mean amplitude of cell-wall length oscillations during 100-mM oscillatory shock with a 2-min period (n = 10 cycles for each measurement). Error bars, ± 1 s.d. p-values: Student’s two-sided t-test, difference from untreated wild-type control. n.s.: not significant.