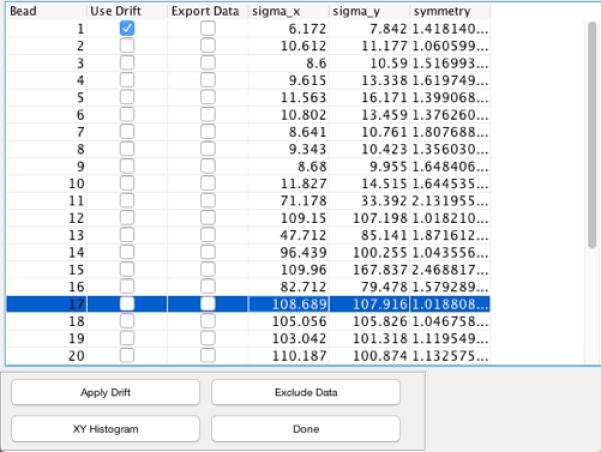
Figure 3.

TPManalysis – Main Window. Particles are listed in the order of ROI origination along with the standard deviations along the X andY directions and symmetry values. Particle 1 is selected as a reference for drift correction. “Export Data” check-boxes can be toggled to mark data for analysis. The “symmetry” column lists values for .
