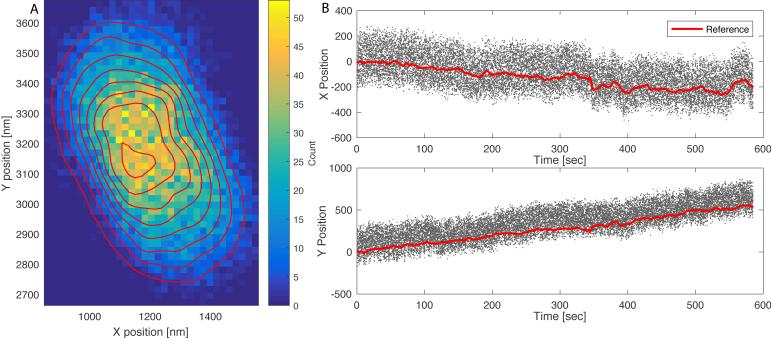
Figure 4.
The XY trajectory of a tethered particle before drift correction. (A) A two-dimensional histogram of particle positions. Shades indicate bin counts (colored online); contours delineate constant height profiles of the distribution. (B) X and Y positions vs. time trajectories for the tethered bead (dots); the thick lines (red online) correspond to the 1-second moving average of the trajectory of a single reference particle.

