
Figure 6.
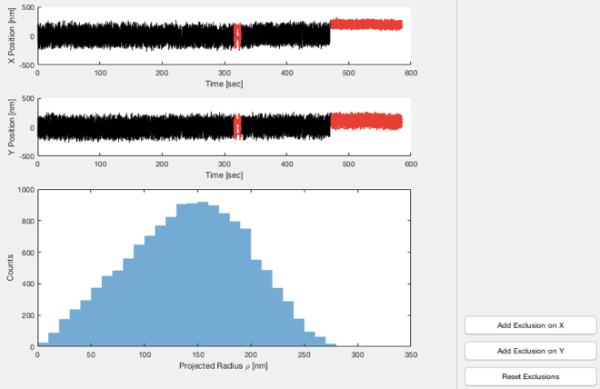
TPManalysis – Data exclusion. The upper panels show X and Y trajectories for a tethered particle. The lower panel shows a histogram of the magnitude of radial excursions about the average X and Y values for the entire segment. Adding exclusions by clicking “Add Exclusion on X” or “Add Exclusion on X” and extending rectangular selections across segments of the X or Y trajectories renders those segments in gray (red online).