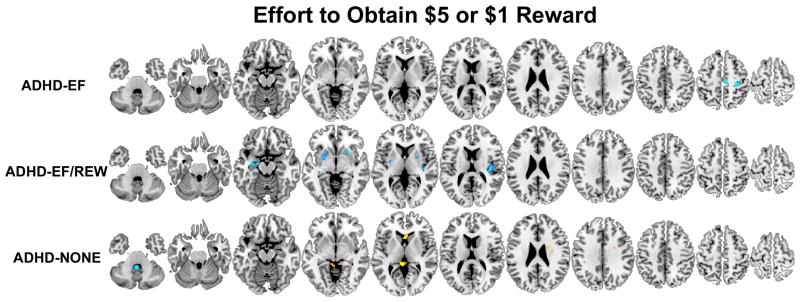
Figure 4.
Brain regions where participants classified by taxometric analysis into the three ADHD subgroups (ADHD-EF/REW, ADHD-EF, and ADHD-NONE) had less (orange-yellow) or more (blue-light blue) activation compared to non-ADHD controls measured during the exertion of effort to obtain monetary reward on the MID fMRI task. Results are thresholded at p<.05 clusterwise corrected for searching the whole brain.

