
Figure 4.
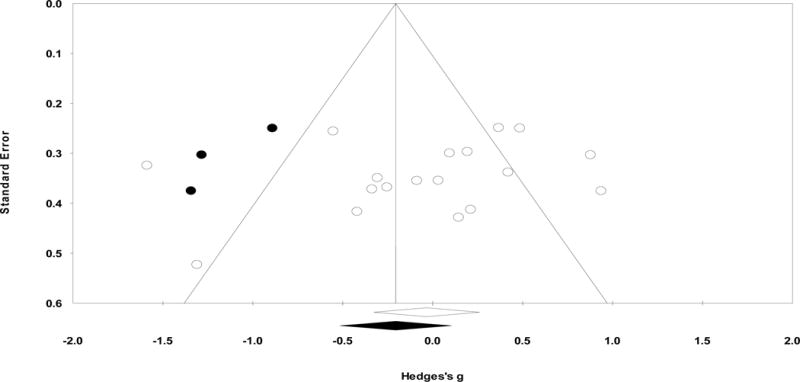
Funnel plot examining publication bias for overall N170 amplitude to faces. Here, Y-axis stands for the standard error of the Hedges’ g and X-axis stands for the Hedges’ g. Each dot stands for an individual study. Using the trim-and-fill procedure, the funnel plot indicates the number of unpublished studies missing due to publication bias (indicated in black dots). The overall effect size did not change significantly when accounting for the unpublished studies.