
Figure 3.
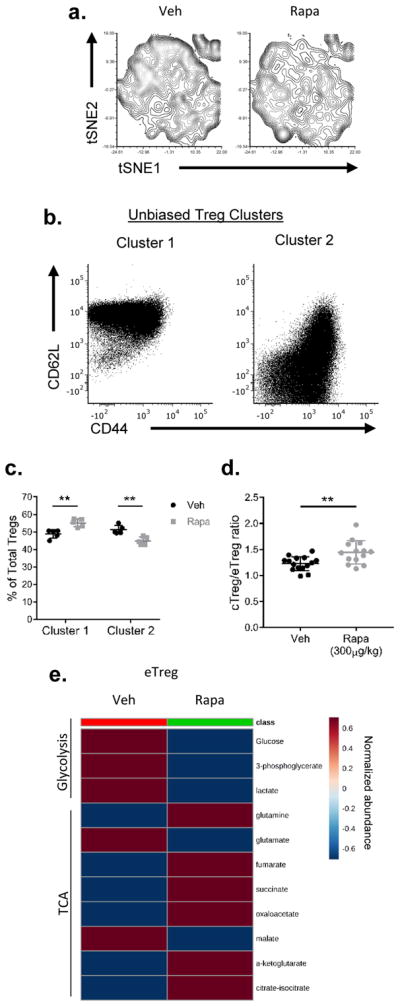
Central and effector Tregs are both sensitive to mTOR inhibition
WT mice were subjected to vehicle (Veh) or rapamycin (Rapa, 300 μg/kg) treatment for 6 days. Mice were sacrificed and the spleens were harvested. (a) t-SNE plot of splenic Tregs from mice treated with or without rapamycin. (b) Relative expression of markers in Tregs defined by clusters 1 and 2 generated from k-mean transformation. (c) Population changes of clusters 1 and 2 upon rapamycin treatment. (d) Ratio of cTreg and eTreg in the spleen. (e) Heatmap showing targeted metabolite differences in eTregs between vehicle and rapamycin treatment groups. **P < 0.005 (2way ANOVA with Bonferroni’s multiple comparisons test (c) or Mann-Whitney t test (d)). Data are representative of two (e) or at least three (a–d) independent experiments.