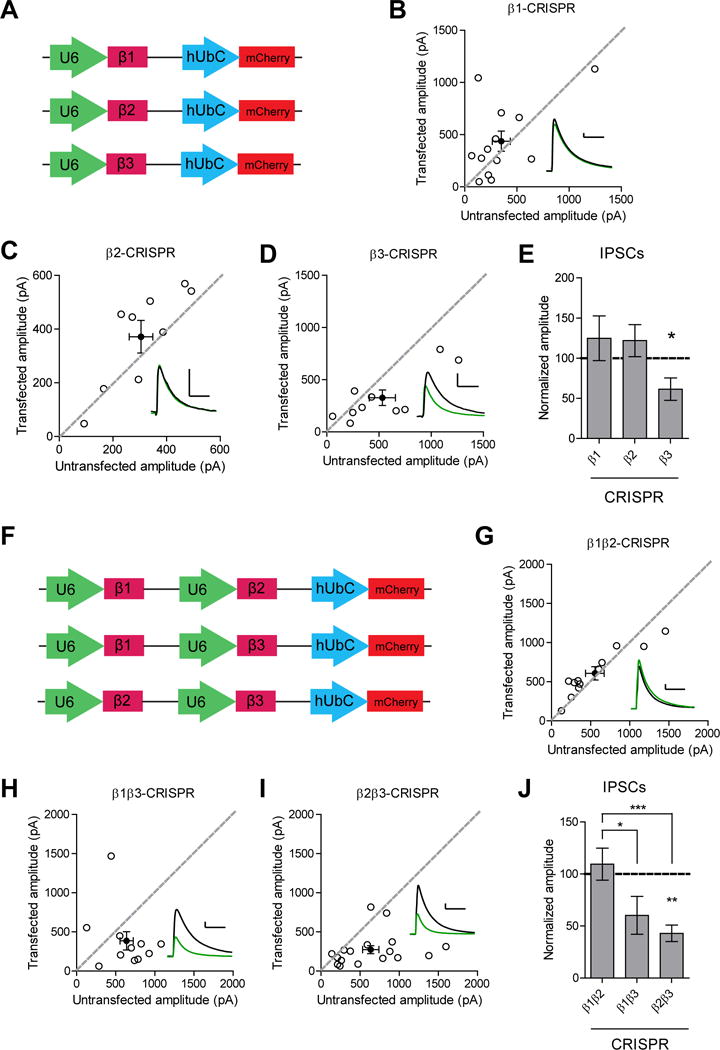
Figure 2. GABAA β3 subunit is important for inhibitory transmission.

A) Diagram of the vector constructs used to express the individual sgRNAs for β1, β2, and β3. B) Scatter plot showing no reduction in IPSCs in β1 CRISPR transfected neurons compared to controls (p = 0.4, n = 13). C) Scatter plot showing no reduction in IPSCs in β2 CRISPR transfected neurons compared to controls (p = 0.1, n = 9). D) Scatter plot showing reduction in IPSCs in β3 CRISPR transfected neurons compared to controls (*p = 0.037, n = 10). E) Summary graph of B-D. F) Diagram of the vector constructs used to express two of the sgRNAs for β1, β2, and β3 at once. G) Scatter plot showing no reduction in IPSCs in β1 and β2 CRISPR transfected neurons compared to controls (p = 0.2, n = 12). H) Scatter plot showing inhibitory currents in β1 and β3 CRISPR transfected neurons were not significantly different compared to controls (p = 0.1, n = 11). I) Scatter plot showing reduction in IPSCs in β2 and β3 CRISPR transfected neurons compared to controls (**p = 0.0024, n = 17). J) Summary graph of G-I. Knockout of both β1 and β3 or both β2 and β3 resulted in currents that were significantly reduced compared to those seen in knockout of both β1 and β2 (*p = 0.015, ***p = 0.0006). For panels B-D, G-I open circles are individual pairs, filled circle is mean ± s.e.m. Black sample traces are control, green are transfected. Scale bars represent 100 pA and 50 msec. For panels E and J summary graph plots mean transfected amplitude ± s.e.m, expressed as a percentage of control amplitude. Significance above each column represents pairwise comparison between transfected and untransfected cells. See also Figure S2 and S3.
