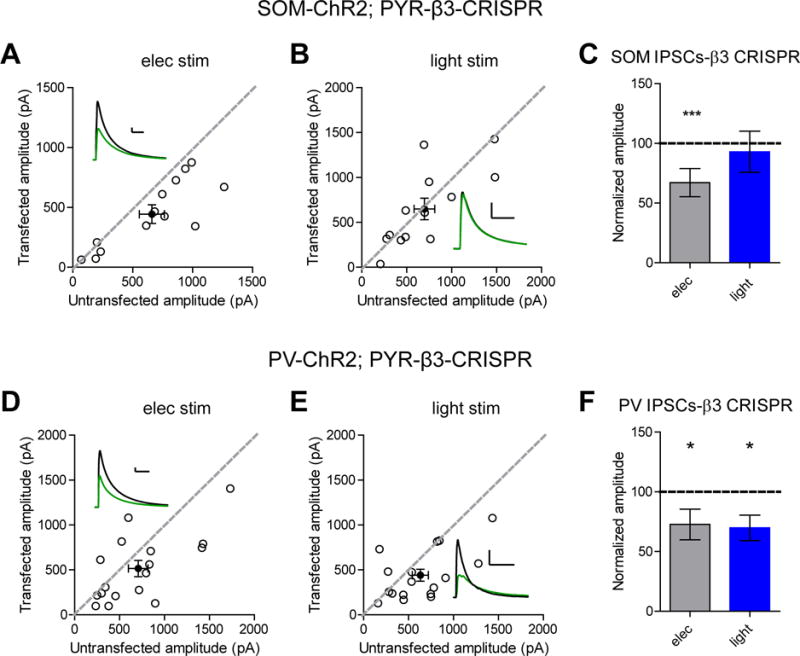
Figure 3. Knockout of GABAA β3 subunit preferentially affects PV not SOM inputs.

A) Scatter plot showing electrical stimulation of hippocampal organotypic slices from SOM-ChR2 transgenic mice still displayed a deficit in inhibitory transmission in pyramidal cells transfected with β3 CRISPR compared to controls (***p = 0.0005, n = 13). B) Scatter plot showing no reduction in IPSCs in β3 CRISPR transfected pyramidal cells when SOM currents are specifically elicited with blue light (p = 0.3, n = 13). C) Summary graph of A-B. D) Scatter plot showing electrical stimulation of hippocampal organotypic slices from PV-ChR2 transgenic mice still displayed a deficit in inhibitory transmission in pyramidal cells transfected with β3 CRISPR compared to controls (*p = 0.04, n = 17). E) Scatter plot showing reduction in IPSCs in β3 CRISPR transfected pyramidal cells when PV currents are specifically elicited with blue light (*p = 0.01, n = 17). F) Summary graph of D-E. For panels A-B and D-E, open circles are individual pairs, filled circle is mean ± s.e.m. Black sample traces are control, green are transfected. Scale bars represent 100 pA and 50 msec. For panels C and F summary graph plots mean transfected amplitude ± s.e.m, expressed as a percentage of control amplitude. Significance above each column represents pairwise comparison between transfected and untransfected cells. See also Figure S4 and S6.
