
Figure 5. Excitatory Synaptic Transmission Is Increased in Tsc1 KO dSPNs.
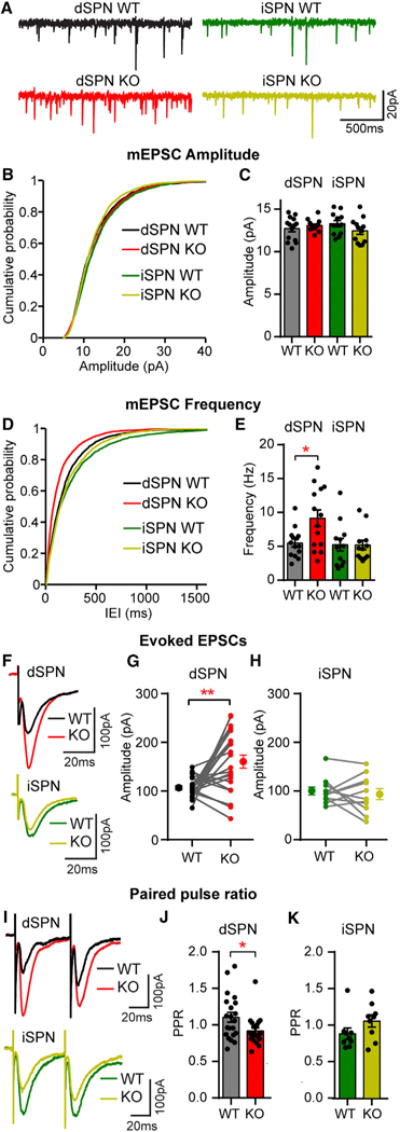
(A) Example traces of miniature excitatory postsynaptic currents (mEPSCs) recorded from each cell type.
(B) Cumulative distribution of mEPSC amplitudes from neurons of each genotype.
(C) Mean ± SEM mEPSC amplitude per neuron for each genotype.
(D) Cumulative distribution of mEPSC inter-event intervals (IEIs) from neurons of each genotype.
(E) Mean ± SEM mEPSC frequency per neuron. *p < 0.05, one-way ANOVA with Sidak’s post hoc test. For (B)–(E), n = 200 mEPSCs per neuron, dSPN WT n = 14 neurons from 10 mice, dSPN KO n = 14 neurons from 10 mice, iSPN WT n = 12 neurons from 8 mice, and iSPN KO n = 12 neurons from 8 mice.
(F) Examples of simultaneously recorded EPSCs from Tsc1 WT and KO pairs of dSPN and iSPNs evoked by intra-striatal electrical stimulation.
(G and H) Graphs displaying the EPSC amplitude recorded from pairs of Tsc1 WT and KO dSPNs (G; n = 22 pairs from 19 mice) and iSPNs (H; n = 11 pairs from 6 mice). **p < 0.01, paired t test. Filled circles with error bars indicate the group mean ± SEM.
(I) Example recordings of electrically evoked EPSCs from two stimuli delivered 50 ms apart.
(J and K) Mean ± SEM paired pulse ratio (PPR; defined as the amplitude of the second EPSC peak divided by the first) in Tsc1 WT and KO dSPNs (J; n = 21 cells from 19 mice) and iSPNs (K; n = 9 cells from 6 mice). *p < 0.05, unpaired t test.
For all panels, dots indicate the values of individual neurons. See Tables S2 and S4 for p values for statistical comparisons. See also Figure S2.