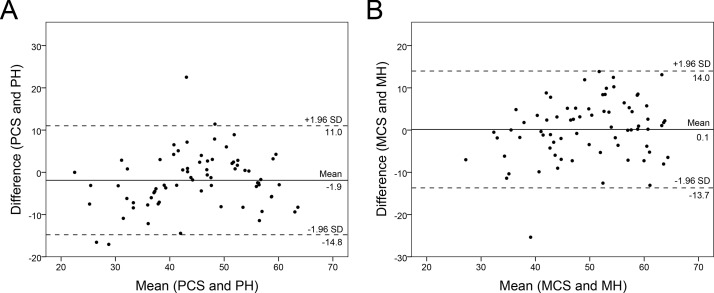
Figure 3.
Bland-Altman plots of Patient-Reported Outcomes Measurement Information System 10-Question Short Form (PROMIS-10) and RAND-36 physical (PH) (A) and mental health (MH) scores (B). The mean of both measures (x-axis) was plotted against their difference (y-axis). The continuous line represents the mean difference and the dashed lines represent the 95% limits of agreement. MCS, mental component score; PCS, physical component score.

