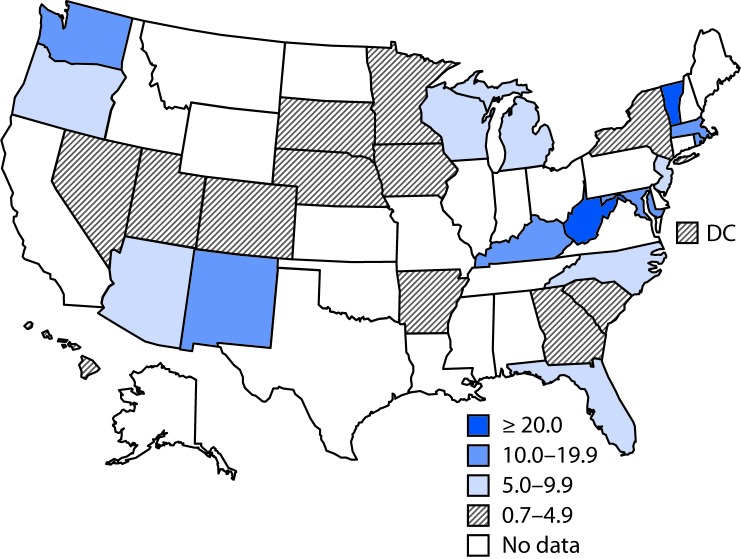
FIGURE 2.
Prevalence of opioid use disorder per 1,000 delivery hospitalizations* — State Inpatient Database, Healthcare Cost and Utilization Project, 28 states, 2013–2014†
* Prevalence numerator consisted of opioid type dependence and nondependent opioid abuse based on International Classification of Diseases, Ninth Revision (ICD-9) codes (304.00–304.03, 304.70–304.73, 305.50–305.53), and denominator consisted of state delivery hospitalization discharges.
† Prevalence reported are for 2014, except for two states (Massachusetts and South Carolina) for which 2014 data were not available; 2013 data are reported for these states.

