FIGURE 5.
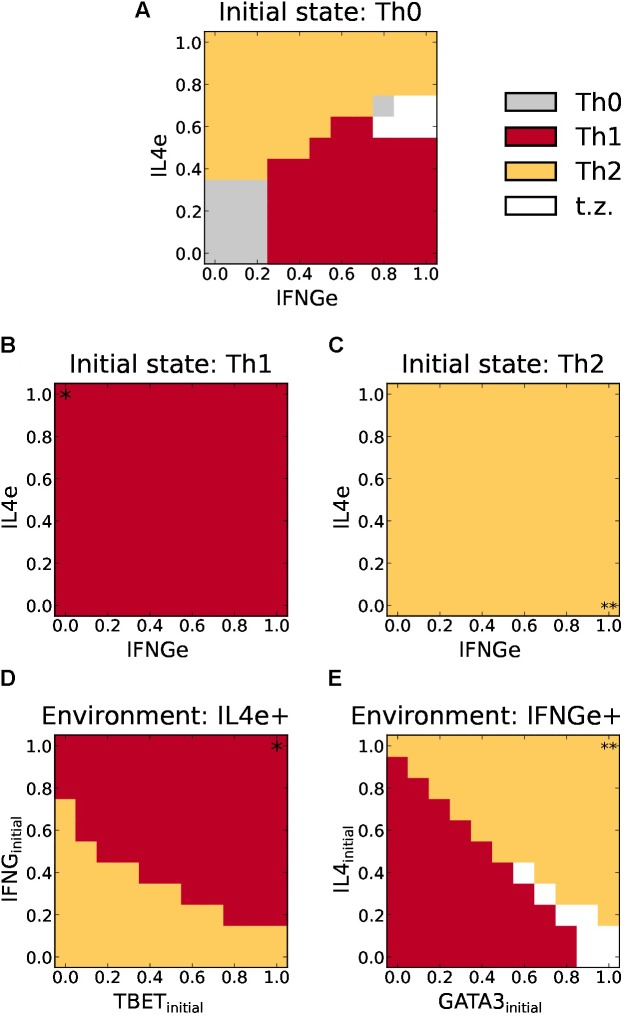
Phenotype space diagrams for Th1 and Th2 polarization and plasticity as a function of the relative concentration of environmental IFNg and IL4, and expression of transcription factors. (A) Diagram for cell differentiation assuming an initial Th0 state. As the external concentration of IFNGe increases, the system develops an abrupt transition from Th0 to Th1. Similarly, an increase in external IL4e drives an abrupt transition from TH0 to Th2. For moderate concentrations of IFNGe and IL4e (< 0.8), we observe two wide zones of Th1 or Th2 prevalence with a sharp boundary, meaning that small variation of cytokines at these zones may change cell polarization. A transition zone with no defined polarization appears at higher concentrations of these cytokines (white and gray areas). (B,C) Plasticity diagrams assuming full Th1 (B) or Th2 (C) polarized states (i.e., induced by INFg = 1 and IL-4 = 1 in diagram A, respectively). No phenotypic transitions are observed under variable concentrations of environmental IL4e and autocrine IFNGe. (D) Plasticity diagram of Th1 cells assuming an environmental concentration of IL4e = 1. Cells require the production of initial high levels of autocrine IFNG and expression of TBET to maintain a Th1 phenotype. If the initial expression levels decrease, especially in the case of autocrine IFNG, it will transit into a Th2 cell. (E) Plasticity diagram of Th2 cells assuming an environmental concentration of IFNGe = 1. The cell requires the production of high levels of autocrine IL4 and expression of GATA3 to maintain a Th2 phenotype. If the initial expression levels decrease it will transit into a Th1 cell. At high expression levels of initial GATA3 and low initial IL4, there exists a transition zone where the cell cannot be classified.

