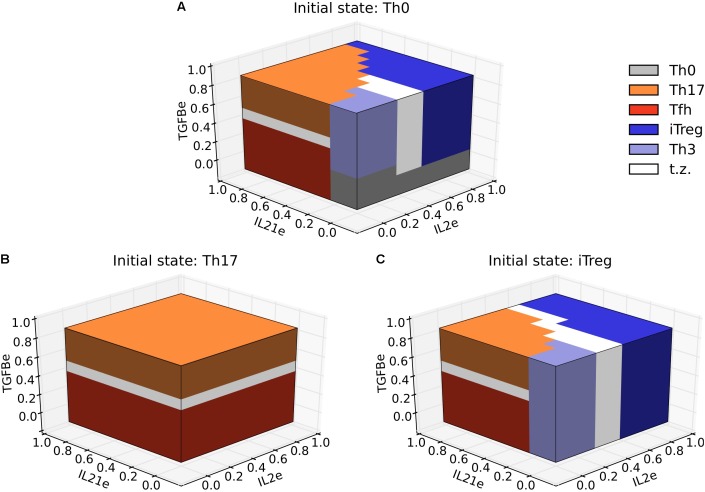
FIGURE 6.
Three-dimensional phenotype space diagrams for Th17 and iTreg polarization and plasticity as a function of the relative concentrations of IL2, IL21, and TGFB in the microenvironment. In the differentiation diagram (A) we observe alternative phenotypic regions defined by relative concentrations of environmental cytokines. The regions may be either separated by a sharp boundary or by a more gradual transition zone (labeled in white). The plasticity diagram (B) indicates a polarized behavior for Th17 versus Tfh phenotype determined by a high or low concentration of external TGFB. A richer behavior ensues when the initial state is Treg, as shown in the plasticity diagram (C). We observe a similar structure as that depicted in A, except that the Th0 zone is absent.

