Figure 1.
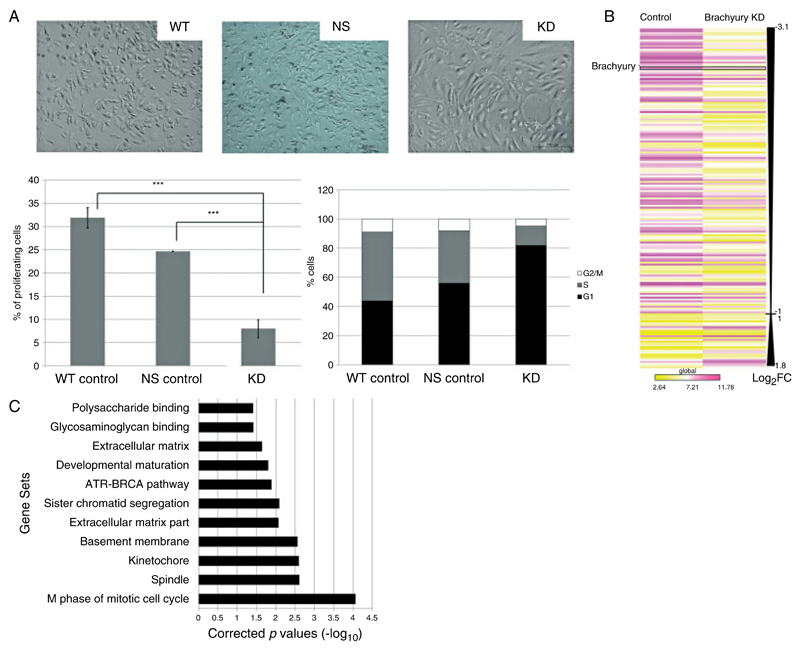
Gene expression data derived from U-CH1 chordoma cells in which brachyury is silenced. (A) Phase contrast photomicrographs of U-CH1 cells showing the epithelioid, physaliphorous appearance characteristic of control wild-type (WT) and non-silencing (NS) vector-transfected chordoma cells contrasted with the spindled, flattened phenotype when brachyury is silenced. Bottom left (cell proliferation assay): bars represent the percentage of U-CH1 cells incorporated with Edu demonstrating a significant reduction in proliferation in the brachyury knockdown cells (KD) compared with both wild-type and non-silencing control cells (***p < 0.01, Student’s t-test). Bottom right (cell cycle analysis): a representative bar graph of the cell cycle profile with brachyury knockdown cells showing more than 80% of cells arrested in G1 phase. (B) Heatmap schematic of the global view of statistically significant differentially expressed genes (log2 fold change of ≥1) in brachyury knockdown U-CH1 cells reflecting a predominance of down-regulated genes. Brachyury is amongst the most down-regulated genes. A complete list of these genes may be found in Supplementary Table 2a. Yellow = lower expression; violet = higher expression; Log2FC = log2 fold change. Comparison between both groups using Student t-test significance p < 0.05. (C) GSEA of the microarray data demonstrates significant enrichment (p < 0.05) of biological pathway and gene ontology gene sets in the control cells compared with U-CH1 cells in which brachyury is knocked down.

