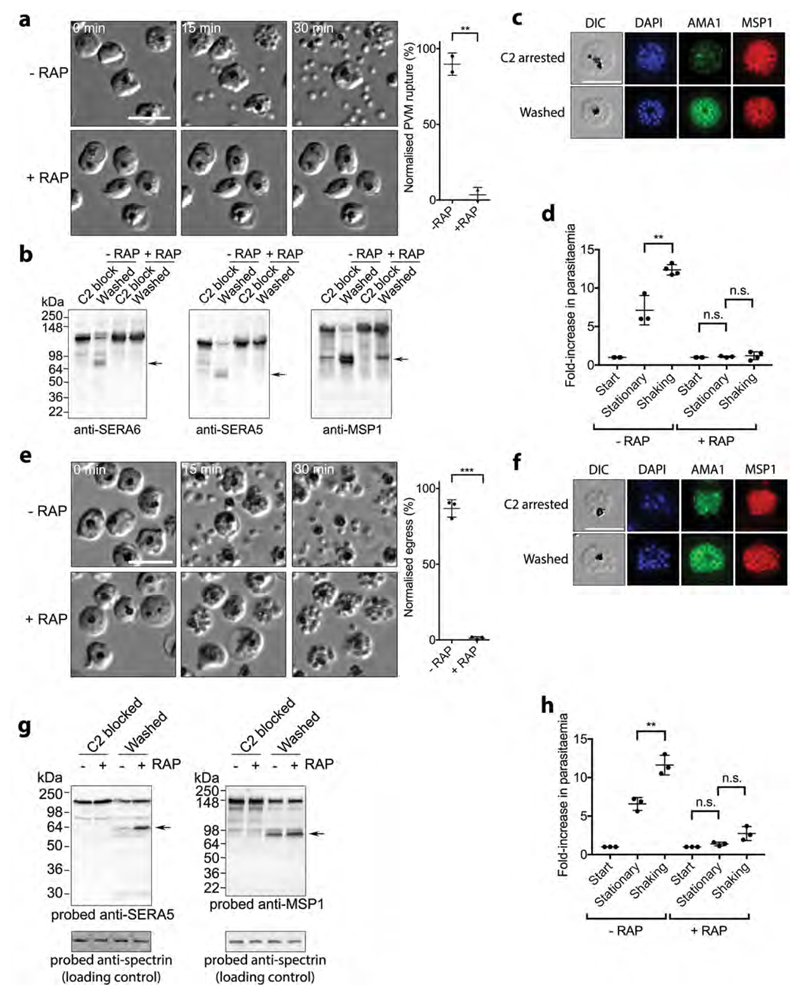
Figure 2. SUB1 and SERA6 play distinct, sequential roles at egress.
a, Left, stills from time-lapse DIC microscopic examination of control (-RAP) and RAP-treated (ΔSUB1) SUB1HA3:loxP schizonts following removal of C2; elapsed time indicated. Scale bar, 20 μm. Right, quantitation of PVM rupture in control and RAP-treated SUB1HA3:loxP schizont populations, collated from 5 videos of each from 2 independent experiments (total number of observed PVM rupture events in control parasites, 226). PVM rupture is normalised to that in the controls (100% egress). Statistical significance determined by two-tailed t-test: -RAP vs +RAP (t=13.84, d.f.=2, p=0.0052, 95% CI -113.2 to -59.5); p≤0.01, **. b, Processing of SUB1 substrates is ablated in ΔSUB1 parasites. Western blot of C2-blocked SUB1HA3:loxP schizonts, or 30 min after washing away C2. Processed forms of SUB1 substrates are arrowed. c, Microneme discharge in ΔSUB1 parasites. IFA of C2-arrested parasites compared to 30 min after washing away C2. Translocation of AMA1 to the intracellular merozoite surface is evident in the washed parasites. Scale bar, 10 μm. d, Invasion by control and RAP-treated SUB1HA3:loxP parasites under static and shaking conditions. Statistical significance by two-tailed t-test: -RAP stationary vs -RAP shaking (t=5.233, d.f.=5, p=0.0034, 95% CI 2.666 to 7.813) n=4; +RAP start vs +RAP stationary (t=1.722, d.f.=5, p=0.1456, 95% CI -0.04104 to 0.2077) n=4; +RAP stationary vs +RAP shaking (t=0.4585, d.f.=5, p=0.6658, 95% CI -0.641 to 0.9193) n=4. Results shown are from 4 biological replicate experiments (some dots are overlaid). e, Left, time-lapse DIC microscopic stills of control and RAP-treated SERA6:loxP schizonts following C2 removal. Scale bar, 20 μm. Right, quantitation of RBCM rupture. Data collated from 8 videos each of control and RAP-treated parasites, from 3 independent experiments (total number of observed rupture events in control parasites, 568). RBCM rupture is normalised to that in the controls (100% egress). Statistical significance by two-tailed t-test: -RAP vs +RAP (t=25.39, d.f.=4, p<0.0001, 95% CI -95.07 to -76.33) n = 3; p≤0.001, ***. f, Microneme discharge in arrested ΔSERA6 parasites. IFA of C2-arrested parasites compared with 30 min after washing away C2. g, Disruption of the SERA6 gene has no effect on processing of SUB1 substrates. h, Invasion efficiencies of the ΔSERA6 parasites under static and shaking conditions. Statistical significance by two-tailed t-test: -RAP stationary vs -RAP shaking (t=5.674, d.f.=4, p=0.0048, 95% CI 2.57 to 7.496) n=3; +RAP start vs +RAP stationary (t=2.741, d.f.=4, p=0.0518, 95% CI -0.004807 to 0.7581) n=3; +RAP stationary vs +RAP shaking (t=2.526, d.f.=4, p=0.0649, 95% CI -0.1348 to 2.855) n=3; p≤0.01, **. Results shown are from 3 biological replicate experiments. In all plots, central bar, mean. Error bars, ±SD. Experiments in panels b, c, f and g were repeated twice, with reproducible results.

