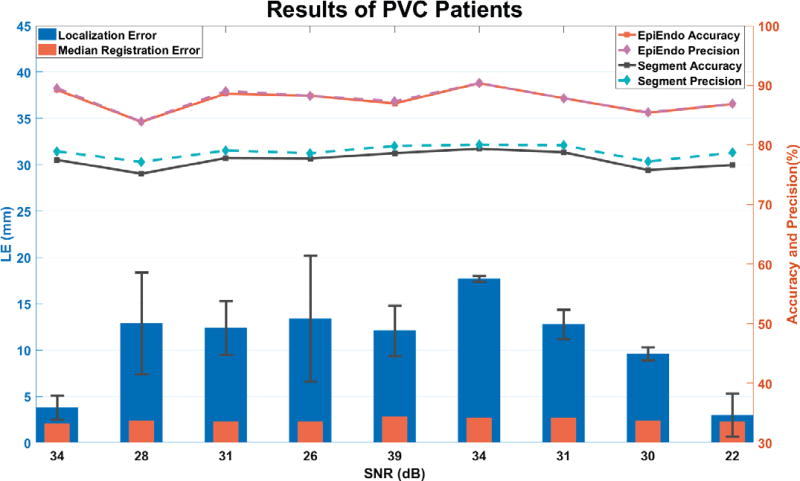
Figure 6.
Results of 9 PVC patients. The right y axis represents the accuracy and average precision rate of the trained Segment CNN and Epi-Endo CNN. And the left y axis shows the average localization error of 10 PVCs from each of 9 patients (blue bars). The orange bars represent the median registration error between the general model and patient’s heart geometry. On the bottom, x axis is the noise level estimated from 12-lead ECGs and is also the noise level we trained and tested the CNNs by adding Gaussian white noise.

