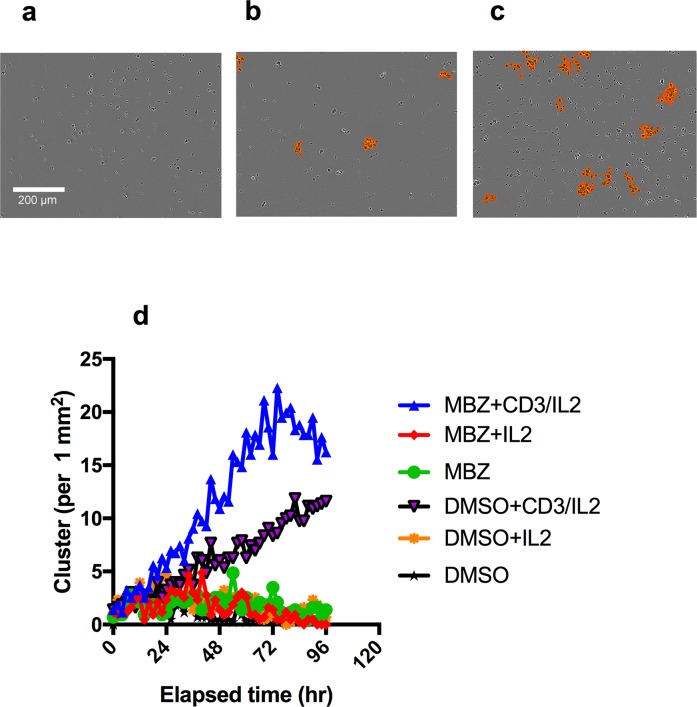
Figure 2. Clustering of PBMC cultures in response to anti-CD3/IL2 and MBZ.
Photomicrographs shows the effect of CD3/IL2 (0.5/2.5 μM) alone (a) together with 1 μM MBZ (b) in comparison with a DMSO exposed control (c) on clustering assessed in the Incucyte Zoom. An orange mask was added to visualise the the criteria used by the Incucyte to define the clusters. In (d) the kinetics of clustering over time is shown. The experiment was repeated at least 3 times with similar results.

