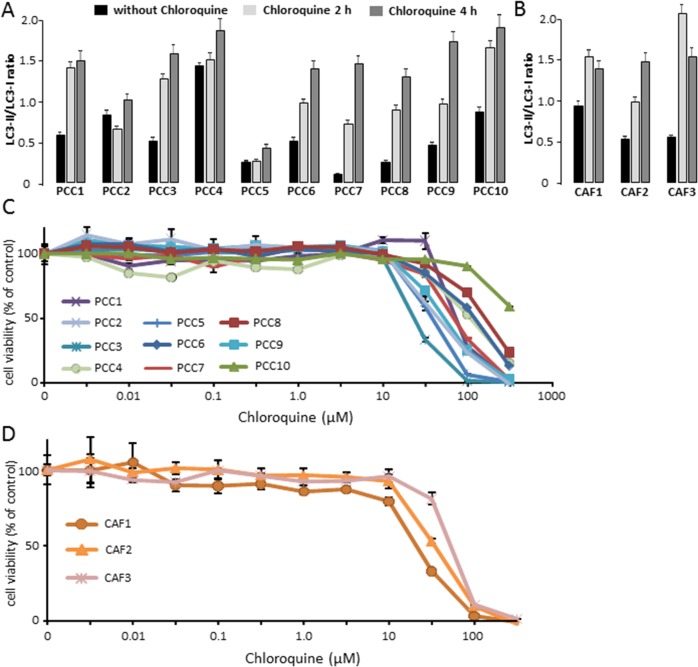
Figure 2.
(A) PCCs treated with 10 μM Chloroquine for 2 h or 4 h, and were compared with control. The estimated ratio of LC3-II/LC3-I was calculated between 2 h and 4 h Chloroquine treatment and basal state. (B) Three different CAFs were treated with 10 μM Chloroquine for 2 h and 4 h, and the ratio of LC3-II/LC3-I was compared with control. (C) PDAC-derived primary cells were treated with increasing concentrations of Chloroquine and the cells viability were measured after 72 h of treatment. (D) CAFs were treated with increasing concentrations of Chloroquine and the cells viability were measured after 72 h of treatment. Error bars ± SEM; n = 3 per group. Experiments were repeated at least 2 times.

