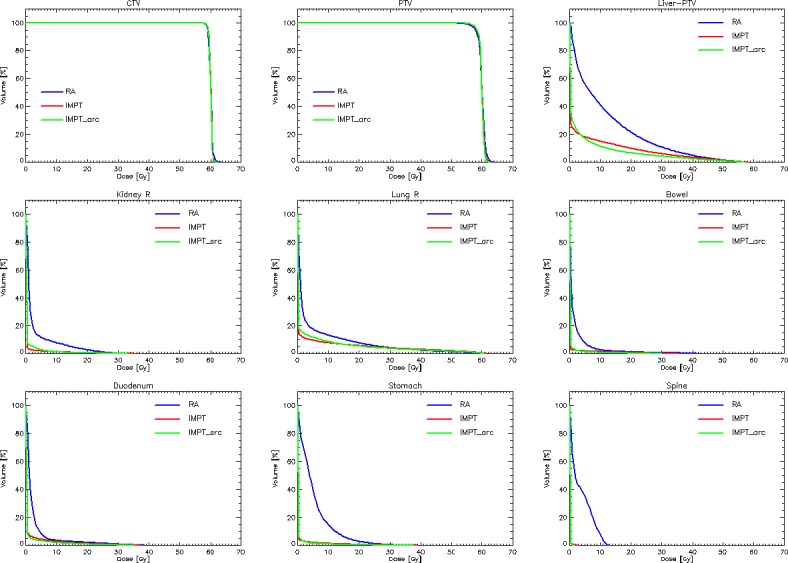
Fig 2. Average dose volume histograms for the CTV, PTV and the main organs at risk investigated.

Data are shown for the photon RapidArc plans and for the proton intensity modulated plans (IMPT) as well as for the surrogate of the rotational proton plans (IMPT arc).
