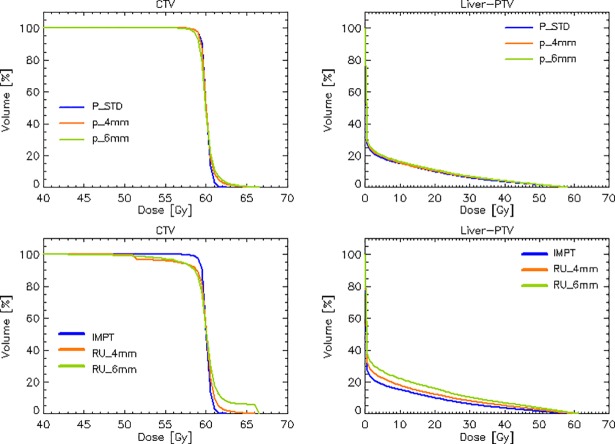
Fig 3.
Upper row: Comparison of the average dose volume histograms for the CTV and the Liver-PTV structures for the reference IMPT plan and the two replicae obtained with the enforcement of the calibration perturbation of 3% and the positioning perturbation of 4 or 6mm. Lower row: the worst-case scenario comparing the reference IMPT plan with the plans subject to the maximal detrimental effect of each of the perturbations.

