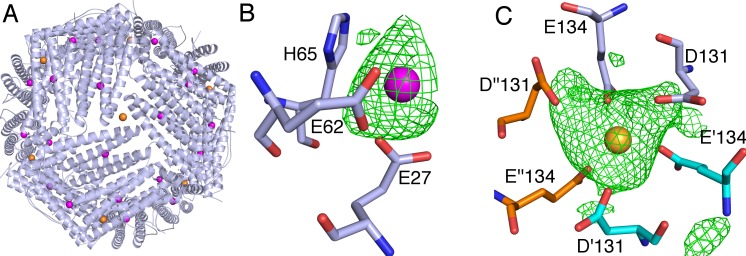
Fig 3. Terbium binding sites from X-ray crystallography.
A) An overall view of the 24-meric shell of HFt-LBT Tb(III) showing the positions of Tb(III), displayed as spheres, is shown. In the close-up view, the omit map contoured at 3 σ as a green mesh is shown for the B) ferroxidase center where Tb(III) is depicted in magenta and for the C) 3-fold axes where Tb(III) is depicted as a yellow sphere and the residues Glu131 and Glu134 of three different monomers are depicted as sticks in light blue, cyan and orange, respectively.

