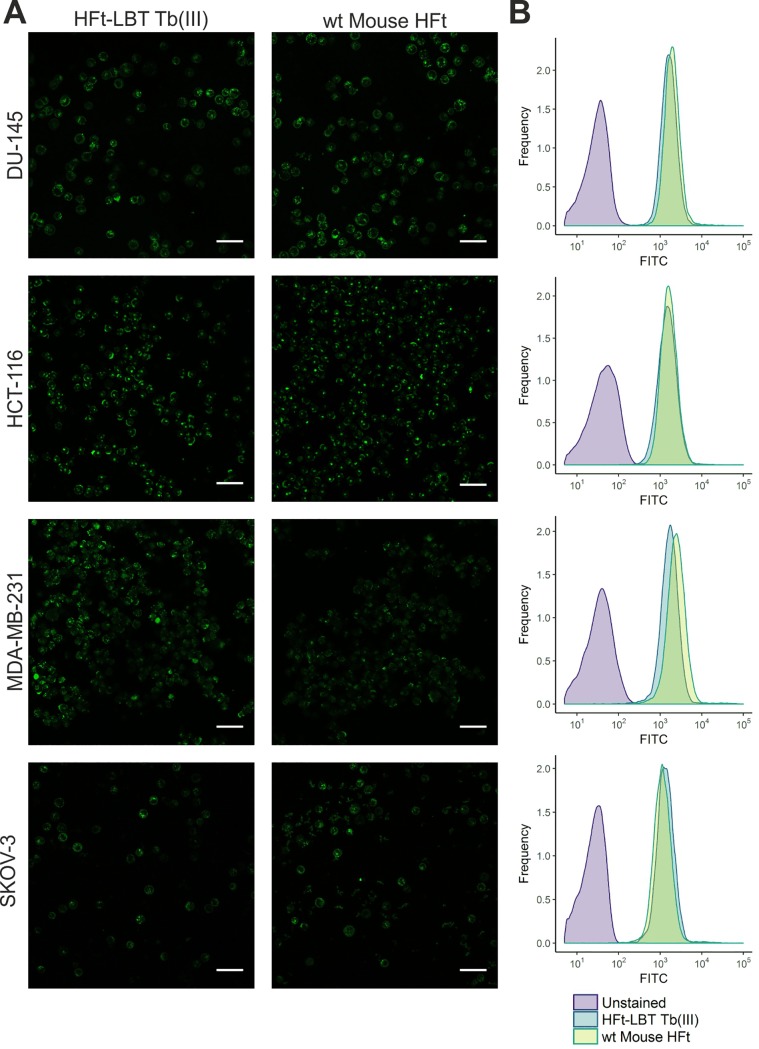
Fig 5. Confocal microscopy images and flow cytometry analysis of HFt-LBT Tb(III) uptake by selected tumor cell lines.
DU-145, HCT-116, MDA-MB-231 and SKOV-3 cancer cells were incubated with either HFt-LBT Tb(III) or wild type mouse HFt (0.5 mg/ml) for 60 min. A) Images acquired by confocal microscopy showing side by side comparison of cellular distribution of HFt-LBT Tb(III) and HFt conjugated with FITC. Scale bar = 50 μm. B) Flow cytometry analysis of HFt-LBT Tb(III) and HFt cellular uptake.

