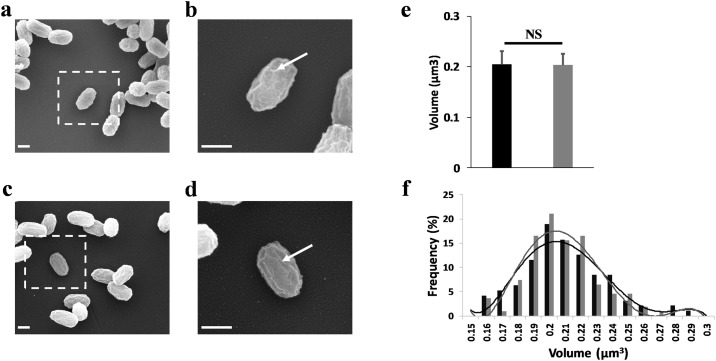
Fig 2. Electric arcs do not induce morphological damage on spores.
(a) SEM image showing a population of untreated spores. Inset shows the location of a zoomed individual spore. (b) High resolution image of a control spore. The white arrow exhibited the protein ridges on spore coat surface. (c) Exposed spores visualized by SEM image after 500 electric arcs exposure. (d) High resolution image of an exposed spore. The electric arcs did not induce disruption of protein ridges (white arrow). Scale bars: 500 nm. (e) Statistical analysis of the spore volume. No variation was observed between untreated and exposed spores. (f) Frequency distribution of the volume of spores in control condition (black bars) and spores exposed (grey bars). Lines indicated the fitted gauss curves. The volumes were calculated from 100 spores in both conditions.

