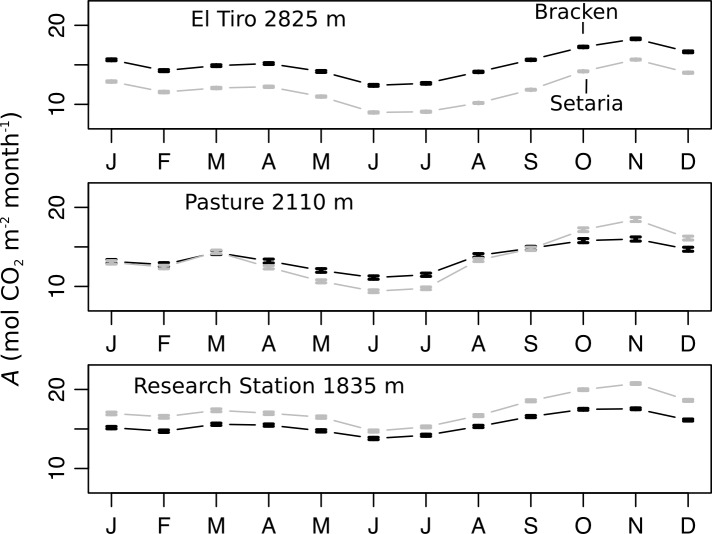
Fig 3. Simulation of canopy photosynthesis of Bracken and Setaria along an altitudinal gradient.
A was simulated by using the SoBraCo model for Bracken (black lines) and Setaria (gray lines) at three different elevations. Species-specific parameters were derived from gas-exchange measurements in the field (Table 2). At the given elevations, weather stations recorded the climate data which were used for the site-specific forcing of the model. For the simulation, the climate data were averaged over the years 1999–2014 for each weather station, and the model was run in hourly time intervals. The error bars show the SEM of the monthly average CO2 assimilation for hundred model runs for each station and species.

