Figure 5.
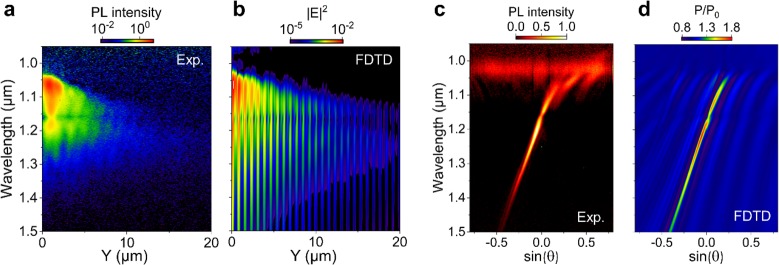
Hyperspectral image (a) and angular distribution (c) of the radiative decay of plexcitons along propagation direction (Y-axis, for X = 0 μm). Corresponding calculated hyperspectral near-field intensity distribution (b) and far-field angular distribution (d). The excitation spot is located 5 μm from the edge of the plasmonic crystal both in the experimental and simulated data.

