
FIGURE 1.
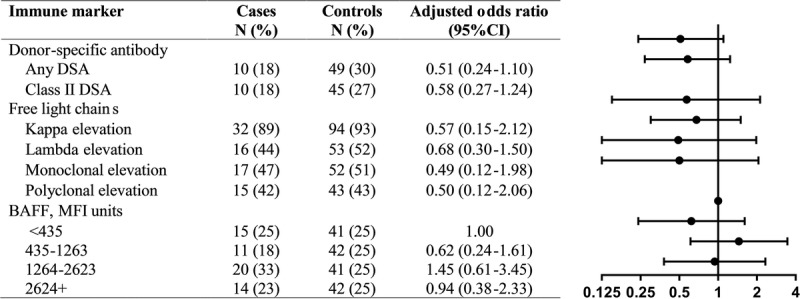
The figure shows the associations of donor-specific antibodies, FLCs, and BAFF levels with PTLD. The forest plot on the right graphically depicts the adjusted odds ratios and 95% confidence intervals. Measurements were available for N = 221 subjects for donor-specific antibody, N = 137 for FLCs, and N = 226 for BAFF. Conditional logistic regression was used for BAFF analyses, accounting for matched sets. Unconditional logistic regression was used for donor-specific antibody and FLC analyses, adjusted for sex, age at transplant, and days from transplant to sample draw date.