FIGURE 2.

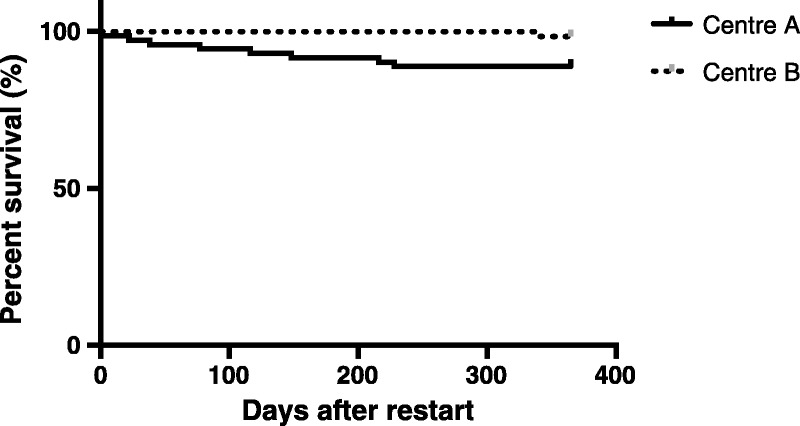
Kaplan-Meier survival analysis censored at 1 year comparing center A and center B. Probability of survival was greater at center B (log rank test P = 0.0248).

Kaplan-Meier survival analysis censored at 1 year comparing center A and center B. Probability of survival was greater at center B (log rank test P = 0.0248).