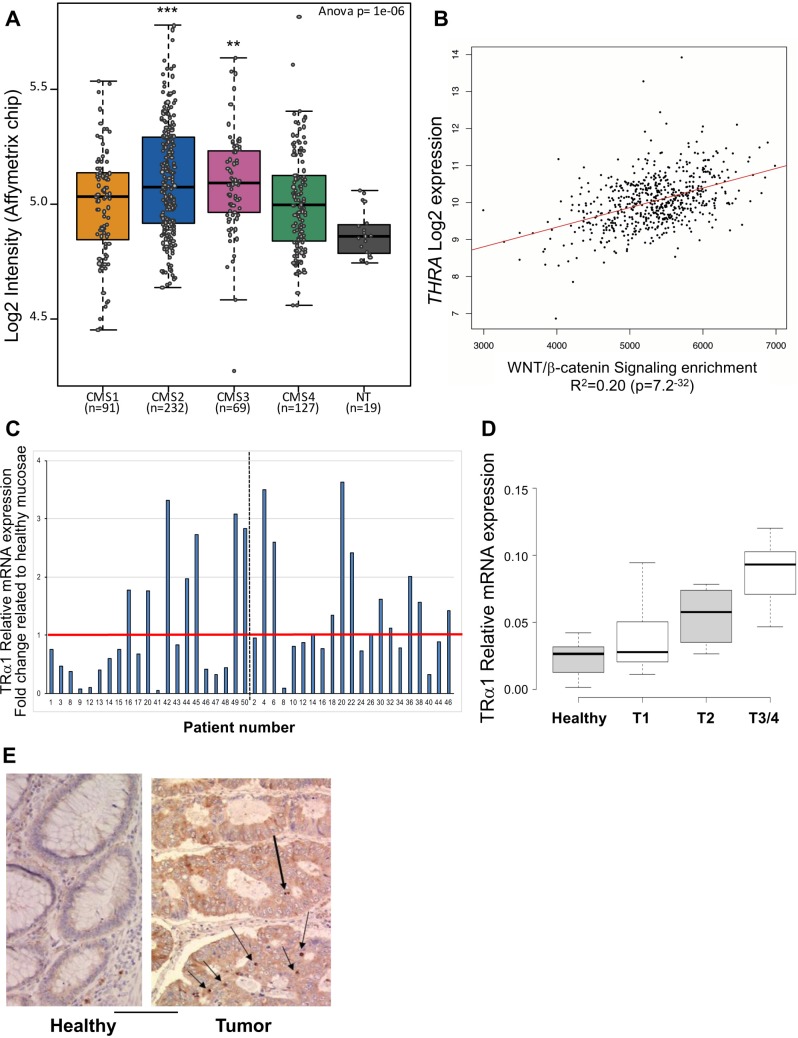
Figure 1. Correlation between TRα1 and Wnt in human colorectal cancer samples.
(A) THRA gene expression levels was evaluated in the GSE39582 dataset [52] and presented as boxplots according to the four-subtypes of the consensus molecular classification of CRC [13]. Note the dispersed expression of THRA in the different groups compared with the healthy mucosae (NT). **P = 0.0021 and ***P = 0.00028 by ANOVA followed by Tukey’s post hoc test. (B) Positive correlation between THRA expression and the Wnt signaling pathway in human CRC. THRA expression values and Wnt/β-catenin signaling enrichment were analyzed in CRC using the TCGA dataset. The graph shows a highly significant (P-value, 7.2 × 10⁻³²) direct correlation between THRA expression levels and Wnt activity. (C) Analysis of TRα1 mRNA expression in cohorts of tumors. Histogram displays TRα1 mRNA expression in each tumor represented as fold change relative to the healthy mucosa of the same patient (expression value in healthy mucosa = 1). The red line delineates over- or unchanged/low-TRα1-expressing tumors; the dotted black line distinguishes the two cohorts analyzed. (D) Analysis of TRα1 mRNA expression in healthy mucosae and tumors illustrated in (C) organized according to the increase in tumor stage (from T1 to T4) as indicated. Boxplots show the distribution of data and the mean (black thick line). (E) Immunohistochemical analysis of TRα1 expression in healthy mucosa and in cancer. TRα1 appears to be clearly expressed in the nuclei of some epithelial cells in cancer but is not-detectable in normal tissue. Bar, 5 µm.

