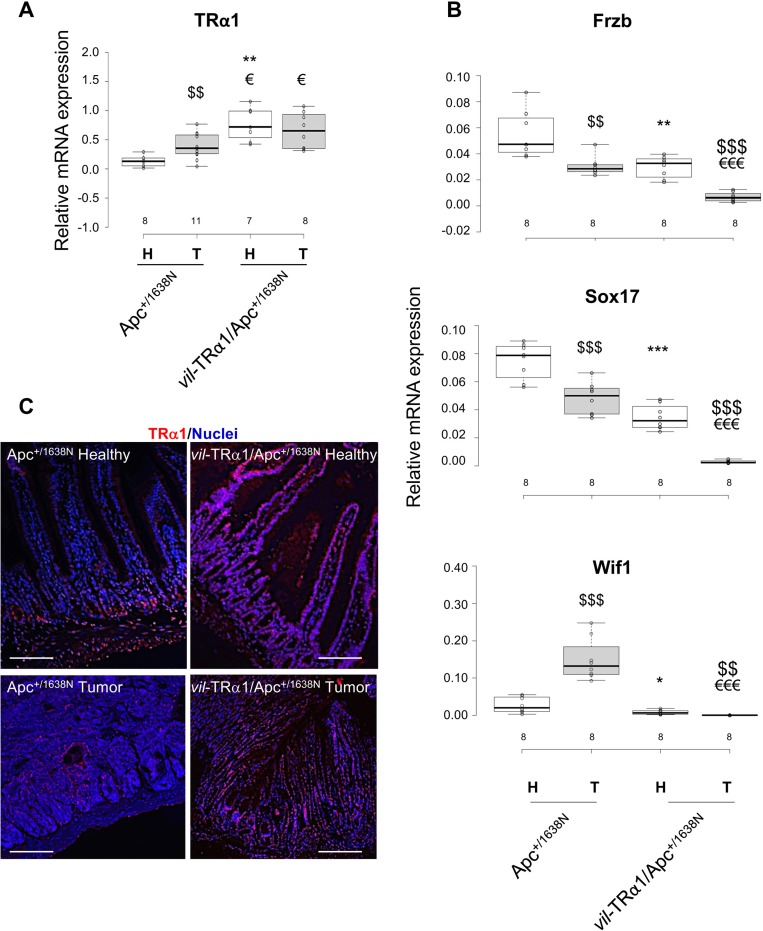
Figure 4. Inverse correlation between TRα1 and Wnt antagonists.
(A, B) Analysis of TRα1 mRNA expression (A) and Frzb, Sox17 and Wif1 mRNA expression (B) in healthy mucosae (H) and tumors (T) from animals of the indicated genotypes. The number of samples analyzed is indicated on the X axis. Boxplots illustrate the distribution of data and the mean (black thick line). Note that Frzb, Sox17 and Wif1 mRNA expression are down-regulated in vil-TRα1/Apc compared to Apc tumors, thus validating the microarray data. *P < 0.05 and **0.01, compared with healthy Apc mucosae; $P < 0.05 and $$P < 0.01, compared with tumor of the same genotype; €P < 0.05 and €€P < 0.01, compared with Apc tumors by Student’s T-test. (C) TRα1 immunolabeling of intestinal sections (healthy mucosa and tumor) from Apc and vil-TRα1/Apc mice as indicated. The images, which are representative of at least three tumors per genotype, show merged nuclear staining (blue) and TRα1 staining (red). Bars, 10 µm.

