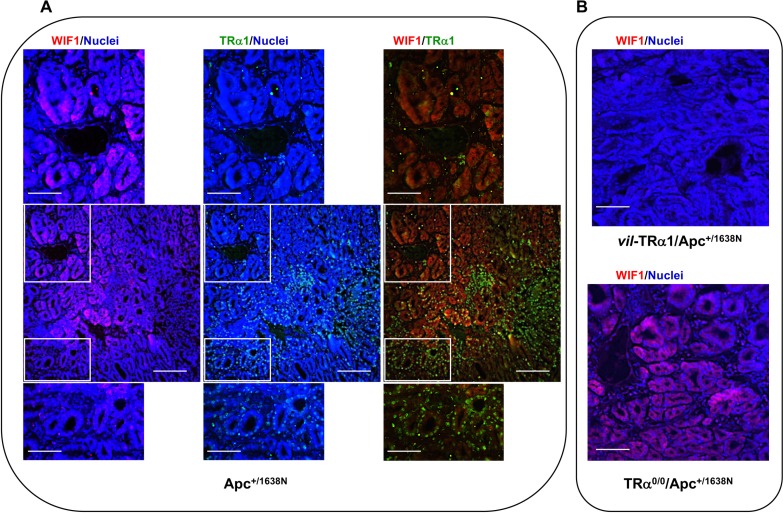
Figure 5. Analysis of TRα1 and WIF1 expression domains.
Immunolabeling of intestinal tumor sections from Apc (A) and vil-TRα1/Apc or TRα0/0/Apc mice (B). The images, which are representative of at least three tumors per genotype, show nuclear staining (blue), protein-specific staining (red or green) and merged images, as indicated. In tumors from Apc mice, TRα1 is heterogeneously expressed, and WIF1 is essentially expressed in areas showing weak TRα1 staining. Bars: A, low magnifications 10 µm, high magnifications 2.5 µm; B, 5 µm.

