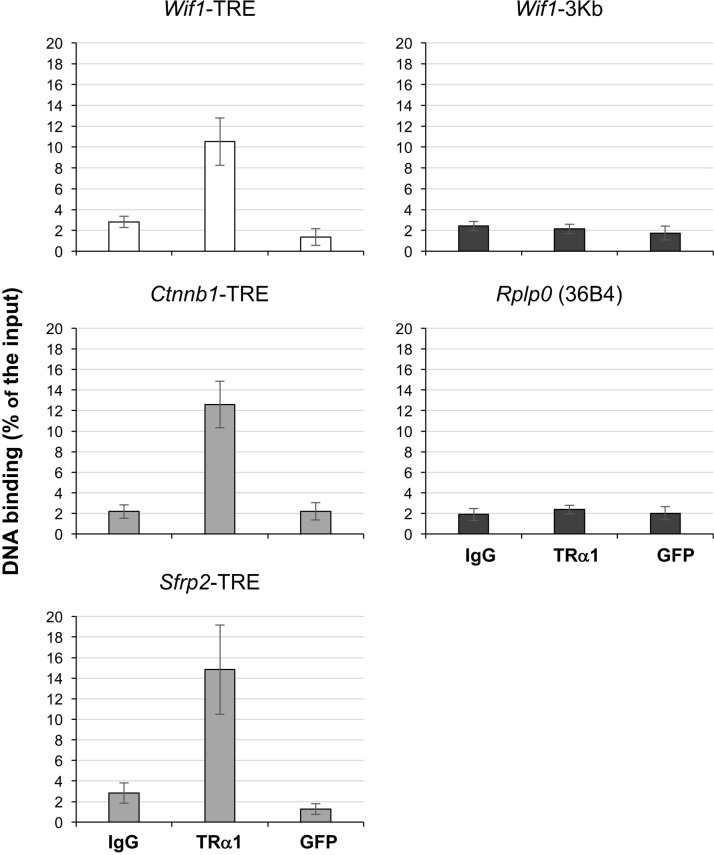
Figure 6. Chromatin occupancy of TRα1 on the Wif1-TRE.
ChIP analysis was performed with chromatin isolated from freshly prepared intestinal epithelial cells from WT mice and immunoprecipitated with anti-TRα1, anti-GFP or rabbit IgG (negative control). qPCR was performed using specific primers covering the Wif1-TRE and the Sfrp2-TRE or the Ctnnb1-TRE (positive controls). Non-specific enrichment of TRα1 was evaluated on a region of the Wif1 gene located 3 Kb upstream the TRE (Wif1-3Kb) and on the Rplp0 (36B4) promoter (negative controls); the Ppia gene was used as an internal control. Histograms represent the mean ± SD, N = 3, of the specific DNA enrichment in each sample immunoprecipitated with the indicated antibody and are expressed as percentages of the starting inputs.

