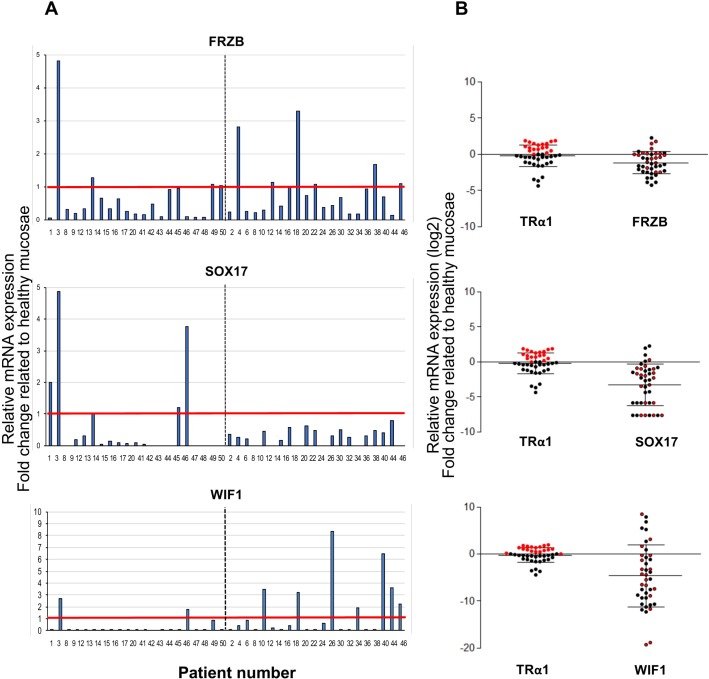
Figure 7. Correlation between TRα1 and Wnt antagonists in human colorectal cancer samples.
(A) Analysis of FRZB, SOX17 and WIF1 mRNA expression in cohorts of tumors. Histograms display the mRNA expression in each tumor represented as the fold change relative to the expression in the healthy mucosa of the same patient (expression value in healthy mucosa = 1). The red line delineates high- or unchanged/low-mRNA-expressing tumors; the dotted black line distinguishes the two cohorts analyzed. (B) Relative mRNA expression of TRα1 and FRZB (upper panel), SOX17 (middle panel) and WIF1 (lower panel) in each tumor, expressed as fold change relative to the healthy mucosa of the same patient. The thick black lanes indicate the means. Red and black dots show expression values of high and unchanged/low TRα1 expressing-tumors, respectively. FRZB/SOX17/WIF1 mRNA expression are represented by red and black circles, corresponding respectively to high- or low-TRα1-expressing tumors. Note that most of the red circles are located well above the black dotted line, which defines tumors with unchanged expression levels.

