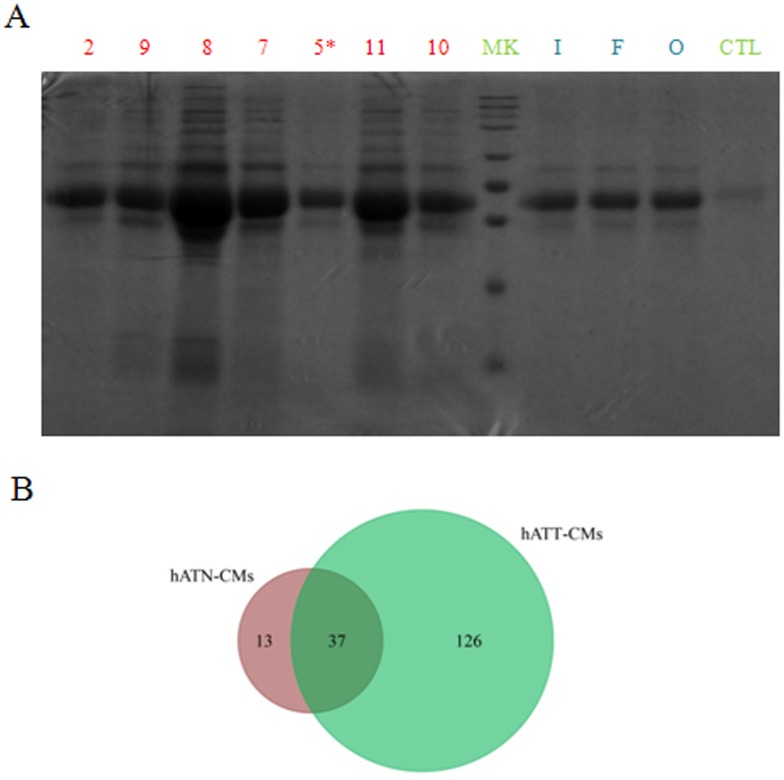
Figure 1. Comparison of protein composition and diversity of hATT-CMs and hATN-CMs.
(A) Proteins present in 100 μl of hATT-CM (n=7) and hATN-CMs (n=3) were separated in a SDS-polyacrylamide gel dyed with Coommassie Brilliant Blue. hATT-CMs: samples 2, 9, 8, 7, 5*, 11 and 10 (Sample 5* was excluded from further analysis because it belongs to a male breast cancer patient). hATN-CMs: samples I, F and O. CTL: control-CM. MK: molecular weight markers. (B) Aliquots of 30 μg of the same CMs were analyzed by 2D-nanoLC-MS/MS. Venn diagram showing unique and common proteins between hATN-CMs (n=3) and hATT-CMs (n=3).

