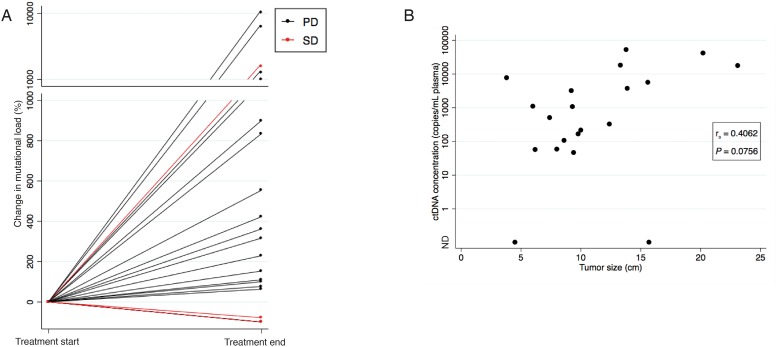
Figure 1. Correlation between ctDNA concentration and evaluation scan.
(A) The percentage change in ctDNA concentration from the baseline sample to the sample drawn at time of the last radiological evaluation illustrated for all 21 patients. Patients with radiological progression on the last evaluation scan (CT or MRI) are illustrated with black lines and patients with radiological stable disease (CT) are illustrated with red lines. Note the break in the y-axis, and the change in intervals. (B) Scatter plot showing the correlation between tumour size determined on the evaluation CT scan and ctDNA concentration at time of the CT evaluation in the 20 patients with an available CT evaluation scan. If various mutations were identified in a sample, the mutation with the highest concentration at progression was used. The P-value was calculated using Spearman’s correlation coefficient.
Abbreviations: CT, computed tomography; MRI, Magnetic resonance imaging; ND, Not detectable; PD, Progressive Disease; SD, Stable Disease.

