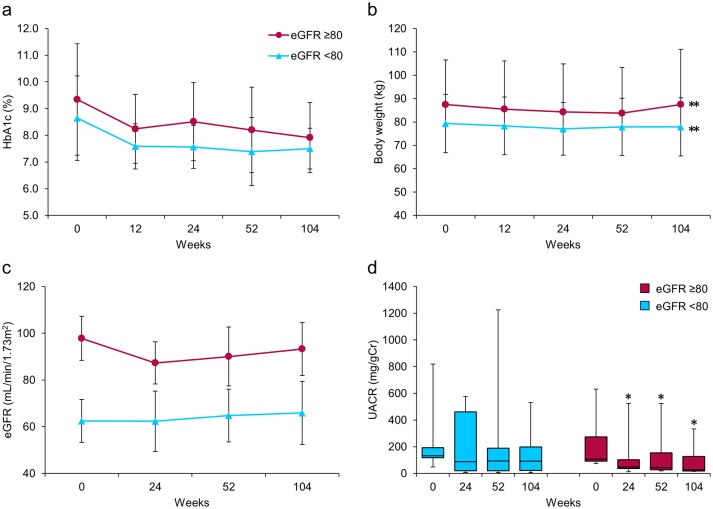
Figure 3.
Effects of ipragliflozin on efficacy parameters at week 104 in patients with diabetic nephropathy (n = 16), classified according to estimated glomerular filtration rate (eGFR) at baseline into two groups; eGFR ≥ 80 (circles; n = 7) and eGFR < 80 (triangles; n = 9). (a) Change from baseline in glycated hemoglobin (HbA1c) to week 104 after starting ipragliflozin administration. (b) Change from baseline in body weight. (c) Change from baseline in eGFR. (d) Change from baseline in urinary albumin-to-creatinine ratio (UACR) at week 104. Data are means ± standard deviation (SD) or medians with the interquartile range (IQR). *P < 0.05, **P < 0.01 versus baseline by the paired t-test. For the UACR, the Wilcoxon signed-rank test was used to evaluate changes between the baseline and week 104. Error bars show SDs or IQRs.

