. 2018 Jul 25;7:e35684. doi: 10.7554/eLife.35684

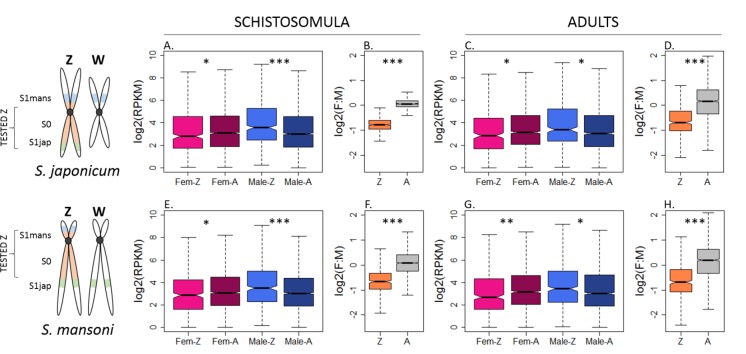
Figure 2. Patterns of expression on the Z and autosomes of S.japonicum and S. mansoni.

Z-linked and autosomal gene expression patterns are shown for S. japonicum (A-D) and S. mansoni (E-H), in undifferentiated schistosomula and sexually mature adults. In panels A, C, E, and G, Fem-Z and Male-Z refer to the expression of Z-linked genes in females and males, respectively, and Fem-A and Male-A to the expression of the autosomal genes in females and males. In panels B, D, F, and H, Z refers to Z-linked genes and A to autosomal genes. In all conditions, a strong male bias is observed for the Z-linked genes (B, D, F, H). This male-biased expression of the Z-linked genes is accompanied by both an under-expression in females and an over-expression in males, compared to the level of autosomal expression (A, C, E, G). The level of significance of each comparison (Wilcoxon rank sum test with continuity correction) is indicated by asterisks: *p-value<0.05, **p-value<0.001, ***p-value<0.0001.

Figure 2—source data 1. RPKM calculation for S. mansoni gene expression.
DOI: 10.7554/eLife.35684.027
Figure 2—source data 2. RPKM calculation for S. japonicum gene expression.
DOI: 10.7554/eLife.35684.028

Figure 2.

Figure 2—figure supplement 1. Adult expression patterns (RPKM>1, exhaustive strata) of genes located in the different strata of the Z (S0, S1man and S1jap), as well as pseudoautosomal and autosomal genes.

Figure 2—figure supplement 1.

The distribution of expression values is shown for (A) S. mansoni females, (B) S. mansoni males, (C) S. mansoni female:male, (D) S. japonicum females, (E) S. japonicum males, (F) S. japonicum female:male, (G) Female expression in S. japonicum divided by female expression in S. mansoni, (H) Male expression in S. japonicum divided by male expression in S. mansoni, (I) female:male ratio of expression in S. japonicum divided by female:male ratio of expression in S. mansoni. Asterisks represent levels of significance of comparisons to the control autosomal genes (*p-value<0.05, **p-value<0.001, ***p-value<0.0001). Genes were assigned to each Z-chromosome stratum based only on their coverage patterns; only genes with RPKM >1 were used.
Figure 2—figure supplement 2. Adult expression patterns (RPKM>0, exhaustive strata) of genes located in the different strata of the Z (S0, S1man and S1jap), as well as pseudoautosomal and autosomal genes.

Figure 2—figure supplement 2.

The distribution of expression values is shown for (A) S. mansoni females, (B) S. mansoni males, (C) S. mansoni female:male, (D) S. japonicum females, (E) S. japonicum males, (F) S. japonicum female:male, (G) Female expression in S. japonicum divided by female expression in S. mansoni, (H) Male expression in S. japonicum divided by male expression in S. mansoni, (I) female:male ratio of expression in S. japonicum divided by female:male ratio of expression in S. mansoni. Asterisks represent levels of significance of comparisons to the control autosomal genes (*p-value<0.05, **p-value<0.001, ***p-value<0.0001). Genes were assigned to each Z-chromosome stratum based only on their coverage patterns; only genes with RPKM >0 were used.
Figure 2—figure supplement 3. Adult expression patterns (RPKM>1, stringent strata) of genes located in the different strata of the Z (S0, S1man and S1jap), as well as pseudoautosomal and autosomal genes.
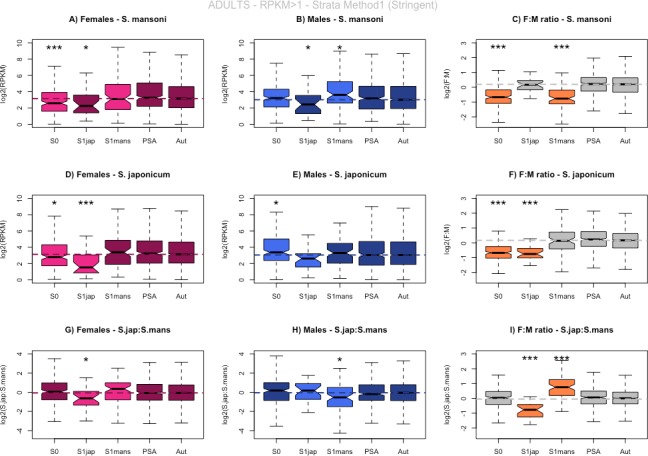
Figure 2—figure supplement 3.

The distribution of expression values is shown for (A) S. mansoni females, (B) S. mansoni males, (C) S. mansoni female:male, (D) S. japonicum females, (E) S. japonicum males, (F) S. japonicum female:male, (G) Female expression in S. japonicum divided by female expression in S. mansoni, (H) Male expression in S. japonicum divided by male expression in S. mansoni, (I) female:male ratio of expression in S. japonicum divided by female:male ratio of expression in S. mansoni. Asterisks represent levels of significance of comparisons to the control autosomal genes (*p-value<0.05, **p-value<0.001, ***p-value<0.0001). Genes previously mapped to the ZW linkage group were assigned to each Z-chromosome stratum based on their coverage patterns (stringent classification); only genes with RPKM >1 were used.
Figure 2—figure supplement 4. Adult expression patterns (RPKM>0, stringent strata) of genes located in the different strata of the Z (S0, S1man and S1jap), as well as pseudoautosomal and autosomal genes.
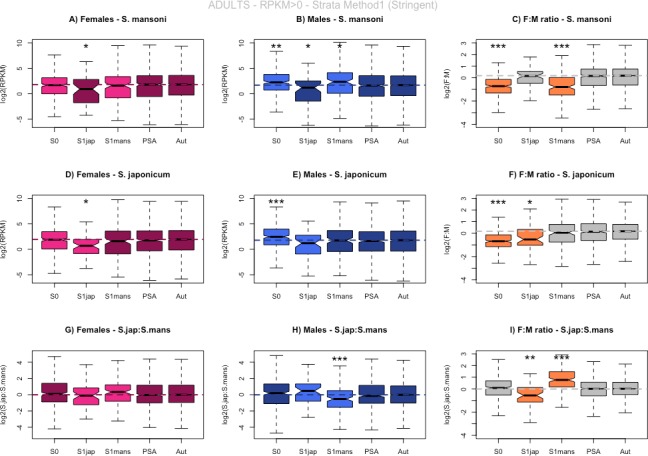
Figure 2—figure supplement 4.

The distribution of expression values is shown for (A) S. mansoni females, (B) S. mansoni males, (C) S. mansoni female:male, (D) S. japonicum females, (E) S. japonicum males, (F) S. japonicum female:male, (G) Female expression in S. japonicum divided by female expression in S. mansoni, (H) Male expression in S. japonicum divided by male expression in S. mansoni, (I) female:male ratio of expression in S. japonicum divided by female:male ratio of expression in S. mansoni. Asterisks represent levels of significance of comparisons to the control autosomal genes (*p-value<0.05, **p-value<0.001, ***p-value<0.0001). Genes previously mapped to the ZW linkage group were assigned to each Z-chromosome stratum based on their coverage patterns (stringent classification); only genes with RPKM >0 were used.
Figure 2—figure supplement 5. Adult expression patterns (RPKM>1, exhaustive strata, Wormbase orthologs) of genes located in the different strata of the Z (S0, S1man and S1jap), as well as pseudoautosomal and autosomal genes.

Figure 2—figure supplement 5.

The distribution of expression values is shown for (A) S. mansoni females, (B) S. mansoni males, (C) S. mansoni female:male, (D) S. japonicum females, (E) S. japonicum males, (F) S. japonicum female:male, (G) Female expression in S. japonicum divided by female expression in S. mansoni, (H) Male expression in S. japonicum divided by male expression in S. mansoni, (I) female:male ratio of expression in S. japonicum divided by female:male ratio of expression in S. mansoni. Asterisks represent levels of significance of comparisons to the control autosomal genes (*p-value<0.05, **p-value<0.001, ***p-value<0.0001). Genes were assigned to each Z-chromosome stratum based only on their coverage patterns; only genes with RPKM >0 were used. This figure differs from Figure 2-figure supplement 1 as the Wormbase Parasite list 1:1 orthologs was used instead of our own reciprocal best hit results.
Figure 2—figure supplement 6. Adult expression patterns (TPM>1, exhaustive strata) of genes located in the different strata of the Z (S0, S1man and S1jap), as well as pseudoautosomal and autosomal genes.

Figure 2—figure supplement 6.

The distribution of expression values is shown for (A) S. mansoni females, (B) S. mansoni males, (C) S. mansoni female:male, (D) S. japonicum females, (E) S. japonicum males, (F) S. japonicum female:male, (G) Female expression in S. japonicum divided by female expression in S. mansoni, (H) Male expression in S. japonicum divided by male expression in S. mansoni, (I) female:male ratio of expression in S. japonicum divided by female:male ratio of expression in S. mansoni. Asterisks represent levels of significance of comparisons to the control autosomal genes (*p-value<0.05, **p-value<0.001, ***p-value<0.0001). Genes were assigned to each Z-chromosome stratum based only on their coverage patterns; only genes with TPM >1 were used.
Figure 2—figure supplement 7. Adult expression patterns (TPM>0, exhaustive strata) of genes located in the different strata of the Z (S0, S1man and S1jap), as well as pseudoautosomal and autosomal genes.
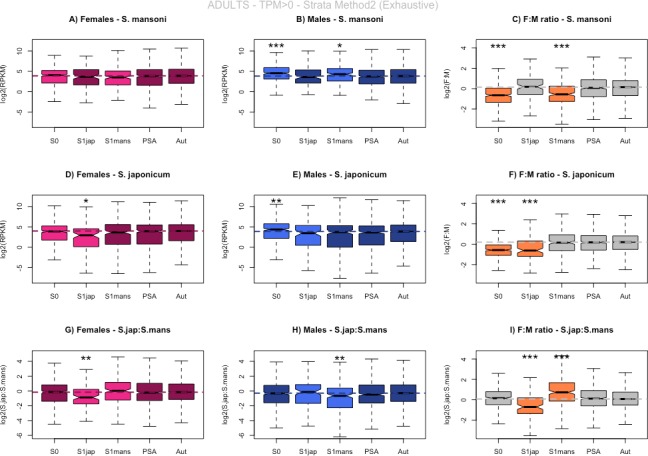
Figure 2—figure supplement 7.

The distribution of expression values is shown for (A) S. mansoni females, (B) S. mansoni males, (C) S. mansoni female:male, (D) S. japonicum females, (E) S. japonicum males, (F) S. japonicum female:male, (G) Female expression in S. japonicum divided by female expression in S. mansoni, (H) Male expression in S. japonicum divided by male expression in S. mansoni, (I) female:male ratio of expression in S. japonicum divided by female:male ratio of expression in S. mansoni. Asterisks represent levels of significance of comparisons to the control autosomal genes (*p-value<0.05, **p-value<0.001, ***p-value<0.0001). Genes were assigned to each Z-chromosome stratum based only on their coverage patterns; only genes with TPM >0 were used.
Figure 2—figure supplement 8. Schistosomula expression patterns (RPKM>1, exhaustive strata) of genes located in the different strata of the Z (S0, S1man and S1jap), as well as pseudoautosomal and autosomal genes.
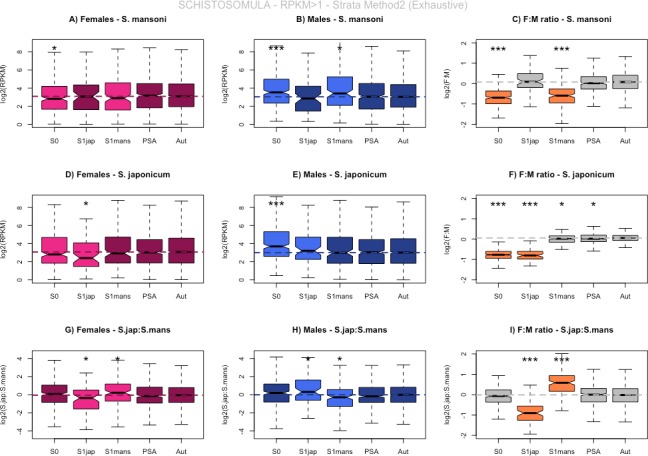
Figure 2—figure supplement 8.

The distribution of expression values is shown for (A) S. mansoni females, (B) S. mansoni males, (C) S. mansoni female:male, (D) S. japonicum females, (E) S. japonicum males, (F) S. japonicum female:male, (G) Female expression in S. japonicum divided by female expression in S. mansoni, (H) Male expression in S. japonicum divided by male expression in S. mansoni, (I) female:male ratio of expression in S. japonicum divided by female:male ratio of expression in S. mansoni. Asterisks represent levels of significance of comparisons to the control autosomal genes (*p-value<0.05, **p-value<0.001, ***p-value<0.0001). Genes were assigned to each Z-chromosome stratum based only on their coverage patterns; only genes with RPKM >1 were used.
Figure 2—figure supplement 9. Schistosomula expression patterns (RPKM>0, exhaustive strata) of genes located in the different strata of the Z (S0, S1man and S1jap), as well as pseudoautosomal and autosomal genes.

Figure 2—figure supplement 9.

The distribution of expression values is shown for (A) S. mansoni females, (B) S. mansoni males, (C) S. mansoni female:male, (D) S. japonicum females, (E) S. japonicum males, (F) S. japonicum female:male, (G) Female expression in S. japonicum divided by female expression in S. mansoni, (H) Male expression in S. japonicum divided by male expression in S. mansoni, (I) female:male ratio of expression in S. japonicum divided by female:male ratio of expression in S. mansoni. Asterisks represent levels of significance of comparisons to the control autosomal genes (*p-value<0.05, **p-value<0.001, ***p-value<0.0001). Genes were assigned to each Z-chromosome stratum based only on their coverage patterns; only genes with RPKM >0 were used.
Figure 2—figure supplement 10. Schistosomula expression patterns (RPKM>1, stringent strata) of genes located in the different strata of the Z (S0, S1man and S1jap), as well as pseudoautosomal and autosomal genes.

Figure 2—figure supplement 10.

The distribution of expression values is shown for (A) S. mansoni females, (B) S. mansoni males, (C) S. mansoni female:male, (D) S. japonicum females, (E) S. japonicum males, (F) S. japonicum female:male, (G) Female expression in S. japonicum divided by female expression in S. mansoni, (H) Male expression in S. japonicum divided by male expression in S. mansoni, (I) female:male ratio of expression in S. japonicum divided by female:male ratio of expression in S. mansoni. Asterisks represent levels of significance of comparisons to the control autosomal genes (*p-value<0.05, **p-value<0.001, ***p-value<0.0001). Genes previously mapped to the ZW linkage group were assigned to each Z-chromosome stratum based on their coverage patterns (stringent classification); only genes with RPKM >1 were used.
Figure 2—figure supplement 11. Schistosomula expression patterns (RPKM>0, stringent strata) of genes located in the different strata of the Z (S0, S1man and S1jap), as well as pseudoautosomal and autosomal genes.

Figure 2—figure supplement 11.

The distribution of expression values is shown for (A) S. mansoni females, (B) S. mansoni males, (C) S. mansoni female:male, (D) S. japonicum females, (E) S. japonicum males, (F) S. japonicum female:male, (G) Female expression in S. japonicum divided by female expression in S. mansoni, (H) Male expression in S. japonicum divided by male expression in S. mansoni, (I) female:male ratio of expression in S. japonicum divided by female:male ratio of expression in S. mansoni. Asterisks represent levels of significance of comparisons to the control autosomal genes (*p-value<0.05, **p-value<0.001, ***p-value<0.0001). Genes previously mapped to the ZW linkage group were assigned to each Z-chromosome stratum based on their coverage patterns (stringent classification); only genes with RPKM >0 were used.
Figure 2—figure supplement 12. Schistosomula expression patterns (RPKM>1, exhaustive strata, Wormbase orthologs) of genes located in the different strata of the Z (S0, S1man and S1jap), as well as pseudoautosomal and autosomal genes.

Figure 2—figure supplement 12.

The distribution of expression values is shown for (A) S. mansoni females, (B) S. mansoni males, (C) S. mansoni female:male, (D) S. japonicum females, (E) S. japonicum males, (F) S. japonicum female:male, (G) Female expression in S. japonicum divided by female expression in S. mansoni, (H) Male expression in S. japonicum divided by male expression in S. mansoni, (I) female:male ratio of expression in S. japonicum divided by female:male ratio of expression in S. mansoni. Asterisks represent levels of significance of comparisons to the control autosomal genes (*p-value<0.05, **p-value<0.001, ***p-value<0.0001). Genes were assigned to each Z-chromosome stratum based only on their coverage patterns; only genes with RPKM >0 were used. This figure differs from Figure 2—figure supplement 8 as the Wormbase Parasite list 1:1 orthologs was used instead of our own reciprocal best hit results.
Figure 2—figure supplement 13. Schistosomula expression patterns (TPM>1, exhaustive strata) of genes located in the different strata of the Z (S0, S1man and S1jap), as well as pseudoautosomal and autosomal genes.
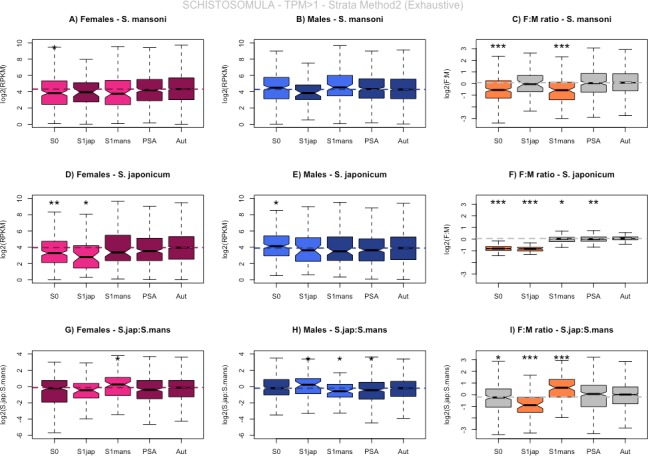
Figure 2—figure supplement 13.

The distribution of expression values is shown for (A) S. mansoni females, (B) S. mansoni males, (C) S. mansoni female:male, (D) S. japonicum females, (E) S. japonicum males, (F) S. japonicum female:male, (G) Female expression in S. japonicum divided by female expression in S. mansoni, (H) Male expression in S. japonicum divided by male expression in S. mansoni, (I) female:male ratio of expression in S. japonicum divided by female:male ratio of expression in S. mansoni. Asterisks represent levels of significance of comparisons to the control autosomal genes (*p-value<0.05, **p-value<0.001, ***p-value<0.0001). Genes were assigned to each Z-chromosome stratum based only on their coverage patterns; only genes with TPM >1 were used.
Figure 2—figure supplement 14. Schistosomula expression patterns (TPM>0, exhaustive strata) of genes located in the different strata of the Z (S0, S1man and S1jap), as well as pseudoautosomal and autosomal genes.
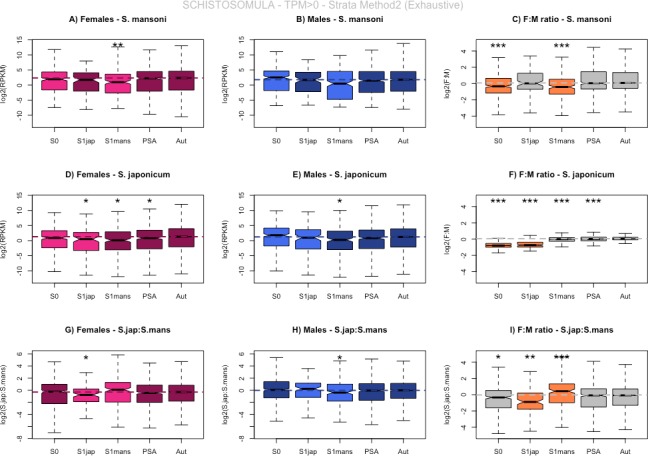
Figure 2—figure supplement 14.

The distribution of expression values is shown for (A) S. mansoni females, (B) S. mansoni males, (C) S. mansoni female:male, (D) S. japonicum females, (E) S. japonicum males, (F) S. japonicum female:male, (G) Female expression in S. japonicum divided by female expression in S. mansoni, (H) Male expression in S. japonicum divided by male expression in S. mansoni, (I) female:male ratio of expression in S. japonicum divided by female:male ratio of expression in S. mansoni. Asterisks represent levels of significance of comparisons to the control autosomal genes (*p-value<0.05, **p-value<0.001, ***p-value<0.0001). Genes were assigned to each Z-chromosome stratum based only on their coverage patterns; only genes with TPM >0 were used.
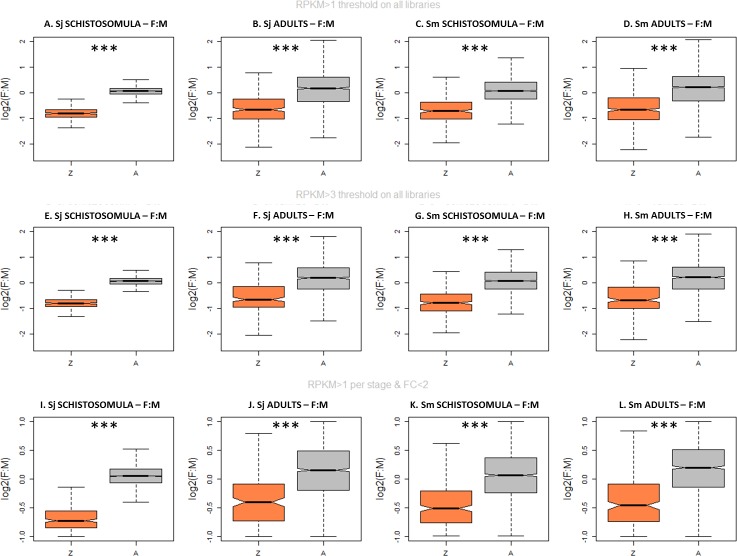
Figure 2—figure supplement 15. Z-linked and autosomal female:male ratio of gene expression using different filters.

Figure 2—figure supplement 15.

The Z-linked and autosomal gene expression patterns are shown in S. japonicum and S. mansoni. Different filters were applied: a minimum threshold of expression of 1 RPKM in all libraries (A–D), a minimum threshold of expression of 3 RPKM in all libraries (E–H), or a minimum threshold of expression of 1 RPKM per stage (as in the main manuscript), together with a filter on fold change to account for strong sex-biases (FC <2 for female:male ratio and male:female ratio) (I-L). Z refers to the female:male ratio of expression in the Z-specific region and A refers to the female:male ratio of expression on autosomes. The level of significance of each comparison is denoted with asterisks: ***p-value<0.0001.
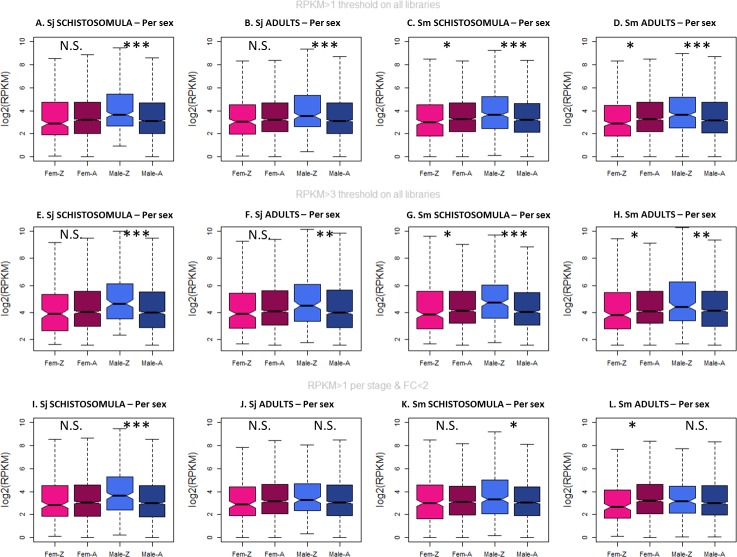
Figure 2—figure supplement 16. Z-linked and autosomal gene expression in females and males using different filters.

Figure 2—figure supplement 16.

The Z-linked and autosomal gene expression patterns are shown for S. japonicum and S. mansoni. Different filters were applied: a minimum threshold of expression of 1 RPKM in all libraries (A–D), a minimum threshold of expression of 3 RPKM in all libraries (E–H), or a minimum threshold of expression of 1 RPKM per stage (as in the main manuscript), together with a filter on fold change to account for strong sex biases (FC <2 for female:male ratio and male:female ratio) (I-L). Fem-Z and Male-Z refers to the female:male ratio of expression in the Z-specific region and Fem-A and Male-A refers to the female:male ratio of expression on autosomes, in female and male, respectively. The level of significance of each comparison is denoted with asterisks: *p-value<0.05, **p-value<0.001, ***p-value<0.0001.
Figure 2—figure supplement 17. Z-linked and autosomal female:male ratio of gene expression according to presence/absence of known protein-protein interactions.

Figure 2—figure supplement 17.

The Z-linked and autosomal gene expression patterns are shown for schistosomula and adults, in S. japonicum (A–B) and S. mansoni (C–D). We considered only genes with minimum level of expression RPKM >1 in all stages, did not take into account the ancestral state of expression, and used the ‘exhaustive strata’ set of genes. -PPIs and +PPIs refer to the female:male ratio of expression in the lineage-specific Z-linked strata S1jap and S1mans, respectively. The level of significance of each comparison is denoted with asterisks: ***p-value<0.0001.