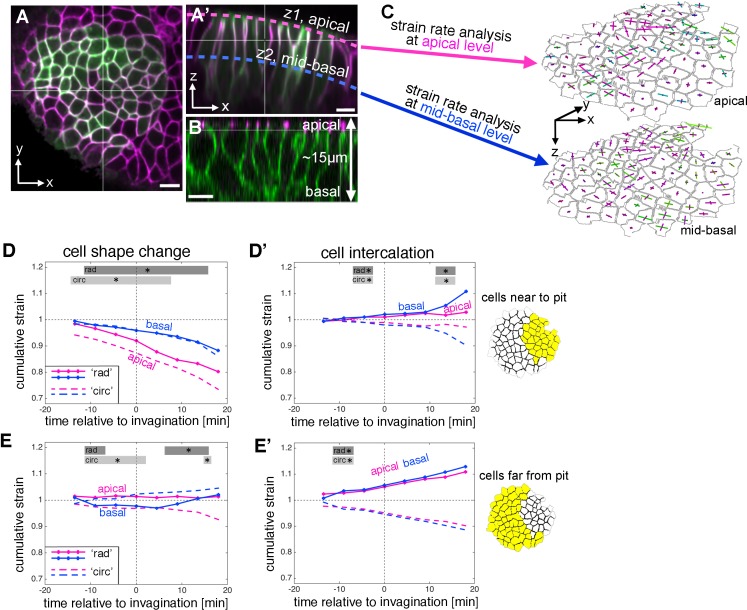
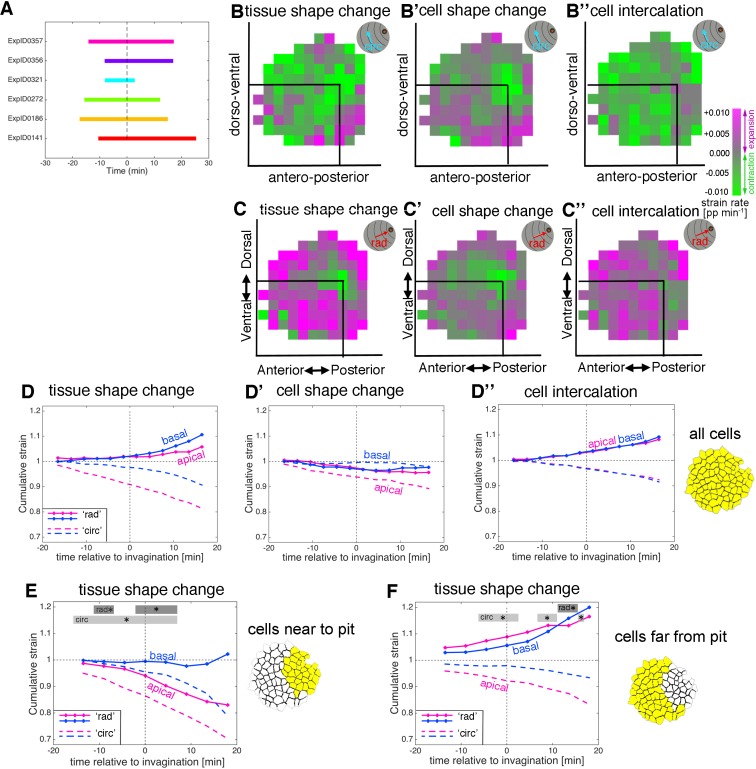
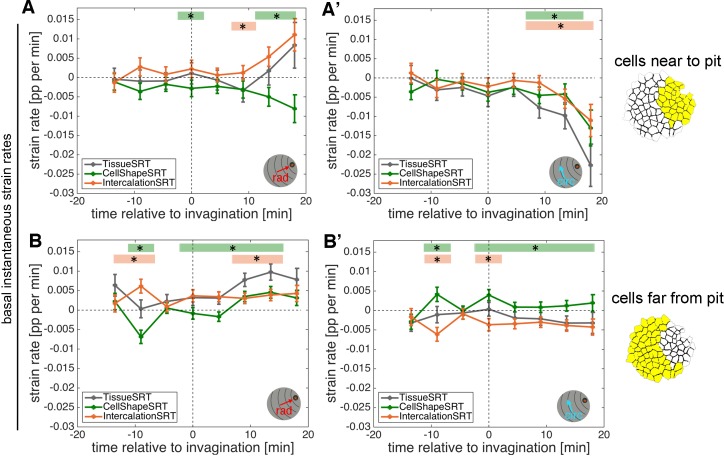
Figure 3. Strain rate analysis of early tubulogenesis using a 3D proxy.
(A–B) Epithelial cells of the placode are about 2–5 µm in apical diameter but extend about 15 µm into the embryo along their apical-basal axis. To assess behaviour of the tissue and cells at depth, we analysed a mid-basal level, about 8 µm basal to the apical surface. Scale bars are 5 µm. (C) Illustration of the method used: we segmented and tracked cells at a depth of ~8 µm, and repeated the strain rate analysis at this mid-basal level (blue) to compare with apical (pink). (D–D’) Comparison of apical (pink, as shown in Figure 2) and basal (blue) cumulative strains, for cell shape changes (D, E) and cell intercalation (D’, E’), near the pit (D,D’) and far from the pit (E,E’). Note how cell shape changes apical versus basal near the pit suggest progressive cell wedging as apices contract isotropically more rapidly than basally (D), and how the rate of cell intercalation across the tissue is highly coordinated between apical and basal, especially in the cells far from the pit (D’,E’). Statistical significance based on a mixed-effects model and a p<0.05 threshold (calculated for instantaneous strain rates [see Figure 2—figure supplement 1 and Figure 3—figure supplement 2]), is indicated by shaded boxes at the top of each panel: apical ‘rad’ vs basal ‘rad’ (dark grey) and apical ‘circ’ vs basal ‘circ’ (light grey).


