
Figure 1. LRRC33 homology to GARP and tissue-specific expression.
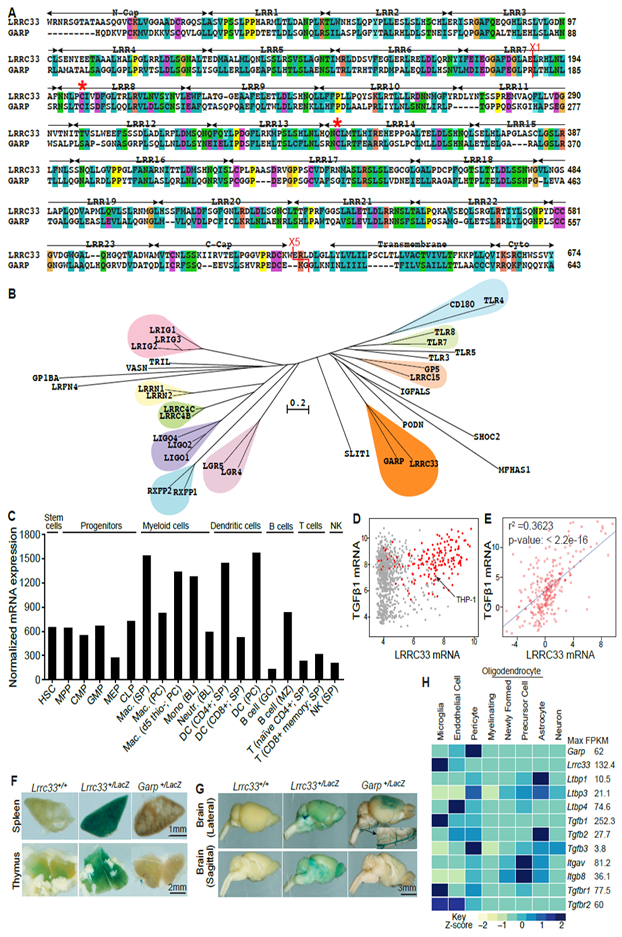
(A) Sequence alignment. Red asterisks (*) mark cysteines that disulfide link to proTGF-β1 (Wang et al., 2012). X1 and X5 mark GARP/LRRC33 chimaera exchange positions. (B) Phylogram of closest LRR-superfamily relatives of LRRC33. Trees were calculated with the NJ method on ectodomains aligned with MAFFT (G-INS-i, gap insertion and extension penalties of 3 and 1, respectively). (C) LRRC33 mRNA expression in murine hematopoietic cells from the ImmGen microarray database. (D) LRRC33 and TGF-β1 mRNA expression in human cancer cell lines in the Cancer Cell Line Encyclopedia; red dots: haematopoietic cell lines. (E) LRRC33 and TGF-β1 mRNA levels positively correlate in normal human tissue, datasets from BioGPS. (F, G) X-gal staining showing LacZ expression in 4-month-old WT, Lrrc33+/− and Garp+/− heterozygous mice. (H) Mouse brain RNAseq data (Zhang, 2014); relative gene expression is shown among 8 cell types isolated from the CNS with FPKM (Fragments Per Kilobase of transcript per Million mapped reads) value shown for the highest expressing cell type.