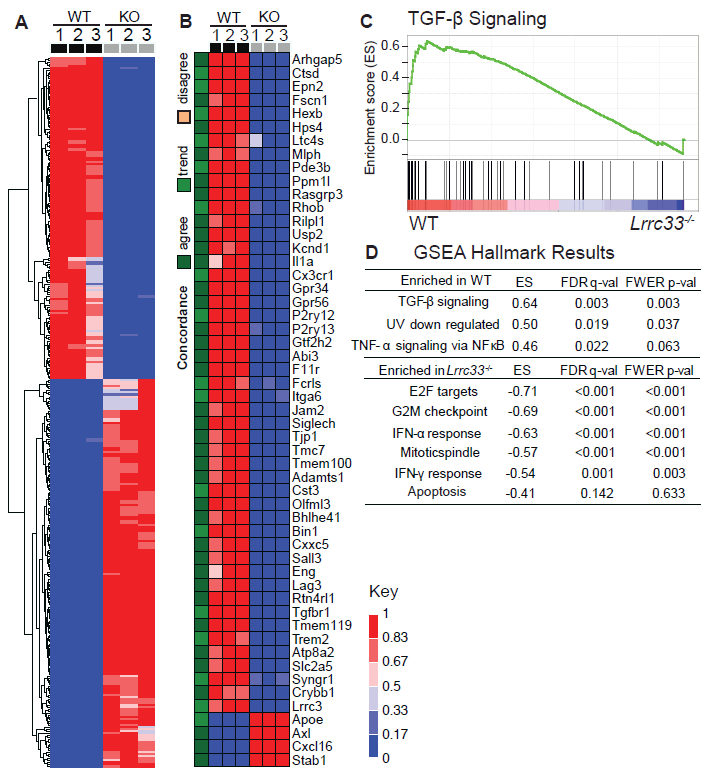
Figure 6. Effect of Lrrc33 deficiency on transcriptional phenotype of microglia.

(A) Microarray data on microglia isolated from brains of 3 WT and 3 KO animals at 3 weeks. Genes are shown with at least a 2.8-fold change and a p value adjusted for multiple comparisons <0.05. Scale shows quotient of difference between sample intensity and row minimum intensity over the row range. (B) Comparison to genes identified as differentially regulated between WT and II2-Tgfb1;Tgfb1−/− microglia (Butovsky et al., 2014). Green-orange scale: agree, change in same direction in our dataset with fold change >2.8 and p-value<0.05; trend, change in same direction in our dataset with fold change <2.8; disagree, opposite direction of change in two datasets. Red-blue scale is same as in (A). (C) GSEA of TGF-β signaling in WT microglia. (D) GSEA results showing the most significant Hallmark differences (Subramanian, 2005). ES, enrichment scores.
