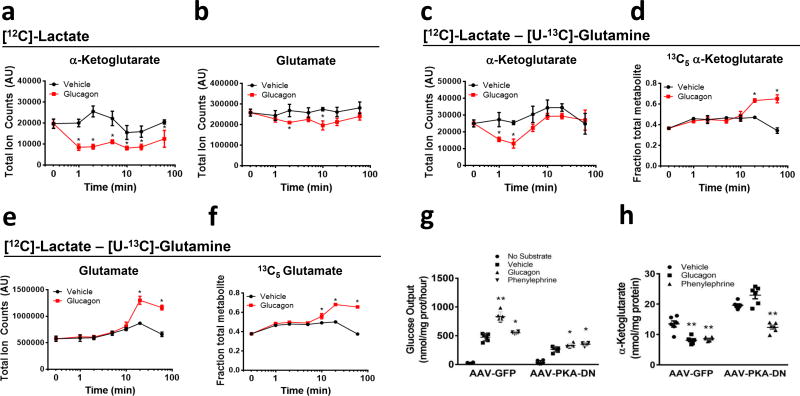
Figure 2.
Kinetics effects of glucagon on α-ketoglutarate and glutamate in primary hepatocytes (a–f). α-ketoglutarate and glutamate levels when (a–b) only [12C]lactate was provided as substrate or (c–d) when both [12C]lactate and [U-13C]glutamine as substrates. (e–f) [5-13C]α-ketoglutarate and [5-13C]glutamate fraction of total metabolite when both [12C]lactate and [U-13C]glutamine were present as extracellular substrates. Values represent triplicates from a pool of hepatocytes from 4 mice and are the mean ± SEM. This experiment was performed once but the effect on α-ketoglutarate was repeated more than 5 times. Glucose production (g) and enzymatic measurement of α-ketoglutarate (h) in primary hepatocytes from mice previously infected with AAV-TBG-GFP or AAV-TBG-PKA-DN. *P < 0.05, **P < 0.01, two-tailed Student’s t-test.

