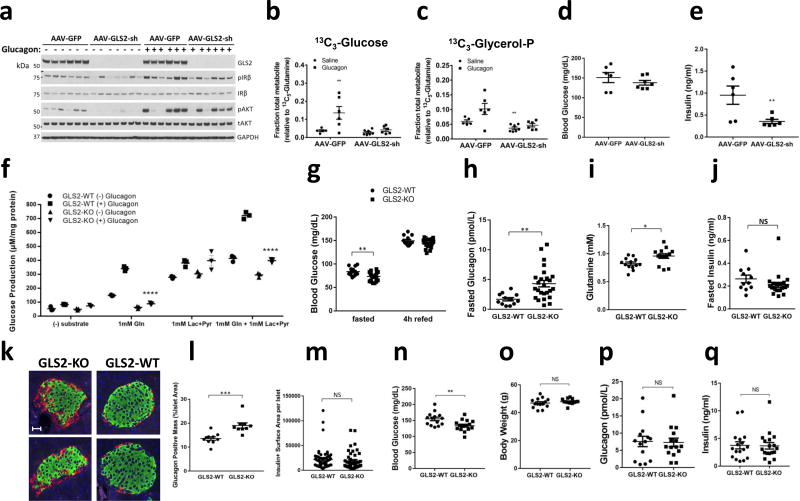
Figure 3.
In vivo glutamine and glucagon infusion study from mice infected with AAV-GFP or AAV-GLS2-sh (a–e). (a) Western blot from liver tissue of GLS2, phosphorylated and total Insulin Receptor β (IRβ), phosphorylated and total Akt, and GAPDH. Hepatic [13C3]glucose (b) and [13C3]glycerol (c) normalized to the tissue [13C5]-glutamine fraction. Blood glucose (d) and plasma insulin (e) measured following infusion. In all panels, values represent the mean of at least 5 biological replicates. These experiments were performed once. (f) Glucose production from primary hepatocytes from fasted GLS2-WT or GLS2-KO mice with indicated substrates: 1mM glutamine and/or 1mM lactate+0.1mM pyruvate in the presence or absence of 100nM glucagon for 1 hour. Values represent three biological replicates. (g–m). GLS2-WT and GLS2-KO mice were fed a chow diet. Animals were were evaluated for (g) fed and fasted blood glucose, (h) fasted plasma glucagon, (i) fasted plasma glutamine, and (j) fasted plasma insulin. WT: KO=13:25 (k) Representative immunofluorescence of glucagon (red) and insulin (green) stains in pancreatic islets of mice fasted overnight, merged with DAPI (blue). Scale bar represents 30 µm. l. Quantification of glucagon positive mass per islets from mice fasted overnight. WT: KO=10:9. m. Quantification of insulin positive surface area per islets from mice fasted overnight. (n–q). GLS2-WT and GLS2-KO mice were fed a high fat diet for 17 weeks. Animals were evaluated for (n) fasted blood glucose, (o) body weight, (p) fasted plasma glucagon, and (q) fasted plasma insulin. Throughout, data are mean ± SEM. *P < 0.05, two-tailed Student’s t-test. NS, not significant.

