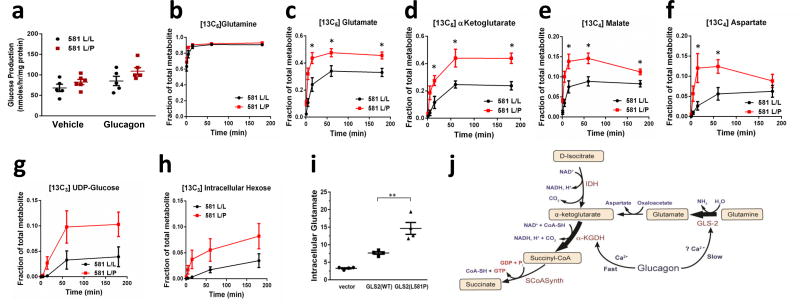
Figure 4.
Glutamine metabolism in primary cryopreserved human hepatocytes from donors genotyped to be homozygous GLS L581L/L and heterozygous L581L/P. (a) Glucose production in the presence of glucagon or PBS vehicle for 1 hour with extracellular glutamine, lactate, and pyruvate substrates. Values are from 5 (L581L/L) and 6 (L581L/P) donors, each representing the mean of 3 technical replicates. *P < 0.05, by two way anova. b–h. Hepatocytes from GLS L581L/L and L581L/P donors were given [13C5]glutamine and unlabeled lactate and pyruvate in kinetic flux studies. Intracellular (b) [13C5]glutamine, (c) [13C5]glutamate, (d) [13C5]a-ketoglutarate, (e) [13C4]malate, (f) [13C4]aspartate, (g) [13C6]UDP-glucose, and (h) [13C6] hexose was measured. Values represent the mean of 6 biological replicates, each from a unique biological hepatocyte donor, for each group and time point, with each biological replicate representative of 3 technical replicates. Error bars represent SEM. The steady state (3 hour time point) data from this experiment was replicated in a separate study (data not shown). *P < 0.05, two-tailed Student’s t-test. (i) Intracellular glutamate level was measured in immortalized human hepatocytes expressing either GLS2(WT) or GLS2(L581P), with cells transduced with lentivirus empty vector as a control. Values represent 4 biological replicates. **P < 0.01, two-tailed Student’s t-test. (j) A model summarizing the proposed effects of glucagon on mitochondrial fluxes. IDH: isocitrate dehydrogenase; SCoASynth: succinate-CoA synthetase.

