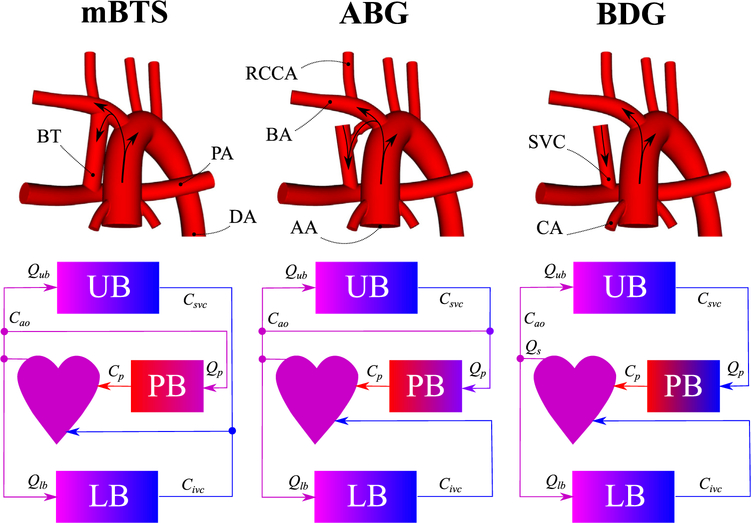
FIGURE 1.
Idealized models of the mBTS, ABG, and BDG (top row). Colors in the circulation schematics (bottom row) represent the level of oxygen concentration. mBTS, Modified Blalock-Taussig shunt; ABG, assisted bidirectional Glenn; BDG, bidirectional Glenn; RCCA, right common carotid artery; BT, Blalock-Taussig shunt; BA, brachiocephalic artery; SVC, superior vena cava; PA, pulmonary arteries; DA, descending aorta; AA, ascending aorta; CA, coronary arteries; Qub, upper-body flow rate; UB, upper body; Csvc, superior vena cava oxygen concentration; Cao, aortic oxygen concentration; Qs, systemic flow rate; Cp, pulmonary vein oxygen concentration; PB, pulmonary bed; Qp, pulmonary flow rate; Qlb, lower-body flow rate; LB, lower body; Civc, inferior vena cava oxygen concentration.

