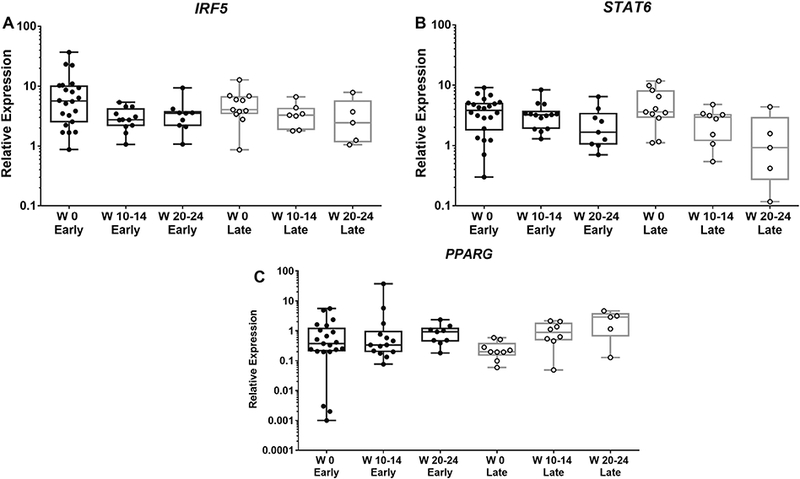
Figure 5: STAT6 and PPARG expression changes similarly in responders and nonresponders.

Total RNA was extracted from peripheral blood CD14+ monocytes; gene expression was determined using RT-PCR, as described in Material and Methods. X-Axis indicates the number of weeks (W) of treatment with rilonacept. Early (responders): achieved ACR Pedi 30 before 4 weeks or less of treatment; Late (responders): more than 4 weeks of treatment to achieve ACR Pedi 30. Boxplots extend from the 25th to 75th percentiles, and the whiskers extend from the minimum to the maximum point; middle lane represents the median. Y-axis shows log10 scale. Statistical analysis used mixed effects regression model. All comparisons p>0.05, and deemed non-significant.
