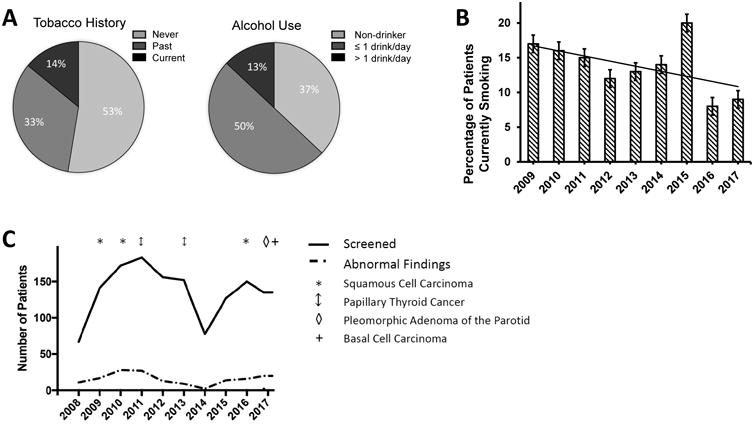
Figure 1.

A. Pie charts showing the tobacco and alcohol use history of screening participants from 2009-2017. B. Graph showing the decreasing trend of tobacco users from 2009 to 2017 with trendline and 95% confidence intervals. C. Graph summarizing the screening results of cancers found.
