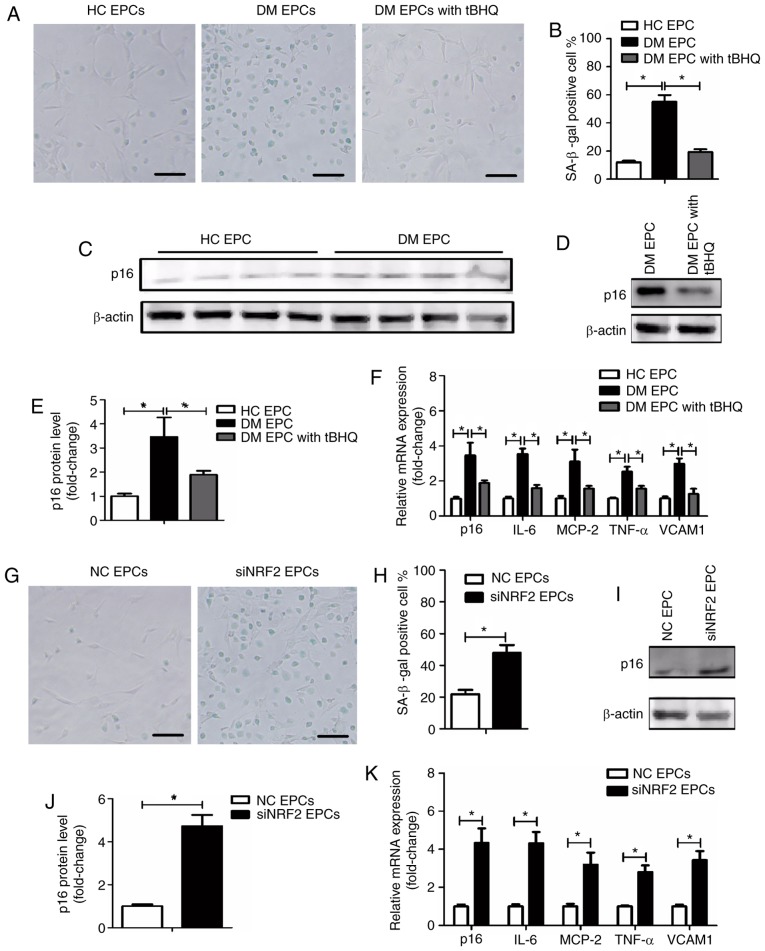
Figure 8.
Nrf2 regulates EPC senescence in DM mice. (A) Representative images and (B) quantification of β-gal staining of HC EPCs, DM EPCs and DM EPCs treated with tBHQ. Scale bar, 100 μm. (C-E) Expression levels of p16 protein in HC EPCs, DM EPCs and DM EPCs treated with tBHQ. (F) mRNA expression levels of p16, IL-6, MCP-2, TNF-α and VCAM1 in HC EPCs, DM EPCs and DM EPCs treated with tBHQ. (G) Representative images and (H) quantification of β-gal staining of NC EPCs and siNRF2 EPCs. Scale bar, 100 μm. (I) Representative blots and (J) quantification of p16 protein expression levels in NC EPCs and siNRF2 EPCs. (K) mRNA expression levels of p16, IL-6, MCP-2, TNF-α, and VCAM1 in NC EPCs and siNRF2 EPCs. *P<0.05, with comparisons indicated by lines (n=4-6). Nrf2, nuclear factor erythroid 2-related factor 2; EPCs, endothelial progenitor cells; DM, diabetes mellitus; HC, healthy control; tBHQ, tert-Butylhydroquinone; IL, interleukin; MCP, monocyte chemotactic protein; TNF, tumor necrosis factor; VCAM1, vascular cell adhesion molecule 1; NC, negative control; si, small interfering.

